Free Practice Questions for the Riverbed RCSP-APM 499-01 Exam (2026 Updated)
At Marks4sure, we are dedicated to providing IT professionals with the most accurate and reliable preparation materials for the Riverbed 499-01 exam. To support your certification journey, we have made a selection of our premium 2026 RCSP-APM practice questions and answers available completely free. You can take this practice test as many times as you need. Every question includes a detailed, expertly verified explanation to ensure you fully grasp the core security concepts before test day.
Riverbed Performance Management allows you to view an application from end-to-end by instrumenting:
Which Riverbed Performance Management solution would be appropriate for companies seeking application code-level tracing and high-level performance monitoring?
Which Riverbed Performance Management solution requires that agents be installed on servers?
For a seamless workflow that spans monitoring, alerts, triage, and diagnosis of root causes, the best overall solution is:
Refer to the exhibit.

In the diagram, what does the WIN < < 7=17408 (in the red rectangle) indicate?
When users cross a load-balancing platform, the load balancer may obfuscate the user ' s IP address. What action ensures the client ' s source IP is seen?
Which Riverbed Performance Management solution includes a complimentary BrowserMetrix license?
When defining rules for the AppResponse Xpert Database Performance Module, which of these fields are mandatory? (Select 3)
For the users in a given business group, which metric is most useful to determine if the end user is experiencing poor response time?
Which application type can be used to define a new application to monitor? (Select 3)
The AppReponse Xpert Database Statement Troubleshooting Insight is useful to: (Select 3)
Which fields are available for each individual page view In the Individual Page Views Insight in the AppResponse Xpert console? (Select 3)
What parameter is used to identify the originating IP in web transaction analysis?
If your company wishes to centrally manage and configure several AppResponse Xpert appliances at once, which of the following solutions would accomplish this?
Which of these are not available to instrument a web application with BrowserMetrix?
How can you change the AppResponse Xpert BrowserMetrix default web user interface communication ports?
For BrowserMetrix, the " time to first byte " and " download and render " time is considered:
Safari seems to outperform other browsers in its response time report. Why is its " time to first byte " so much shorter than other browsers? (Select 2)
What is the most recommended network time protocol (NTP) configuration for AppInternal Xpert?
In AppInternals Xpert consoles, you can click on a transaction trace or metric to open the line of source code that defines the generic class.method that generated that transaction or metric when applicable. Which statements are true regarding linking between source code and AppInternals Xpert data? (Select 3)
What granularity of data is available on the Service Management Platform (SMP)? (Select 2)
Which data sources would be used to provide end-user experience monitoring? (Select 2)
With which components can you group data behind a single instrument? (Select 3)
When building a Dashboard panel for showing worst-case heap health status, which metrics should you select for optimal results?
Refer to the exhibit.
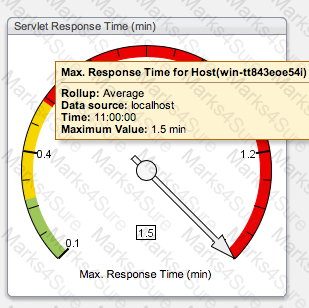
Given that the gauge is at its maximum point, which of these statements apply? (Select 2)
What is the easiest way to verify dashboard contents without opening the dashboard?
Which of the following features are not present on AppTransaction Xpert standard?
On which default TCP port does the AppTransaction Xpert console communicate with its agents?
What default threshold does the AppDoctor use to detect user think time on the client tier?
The AppDoctor Summary of Delays window divides the total transaction response time into which two primary components of delay? (Select 2)
Which color in the AppDoctor summary of delays indicates that the transaction is sensitive to latency?
What is required for AppTransaction Xpert to decrypt packets successfully? (Select 2)
Refer to the exhibit from the AppDoctor.
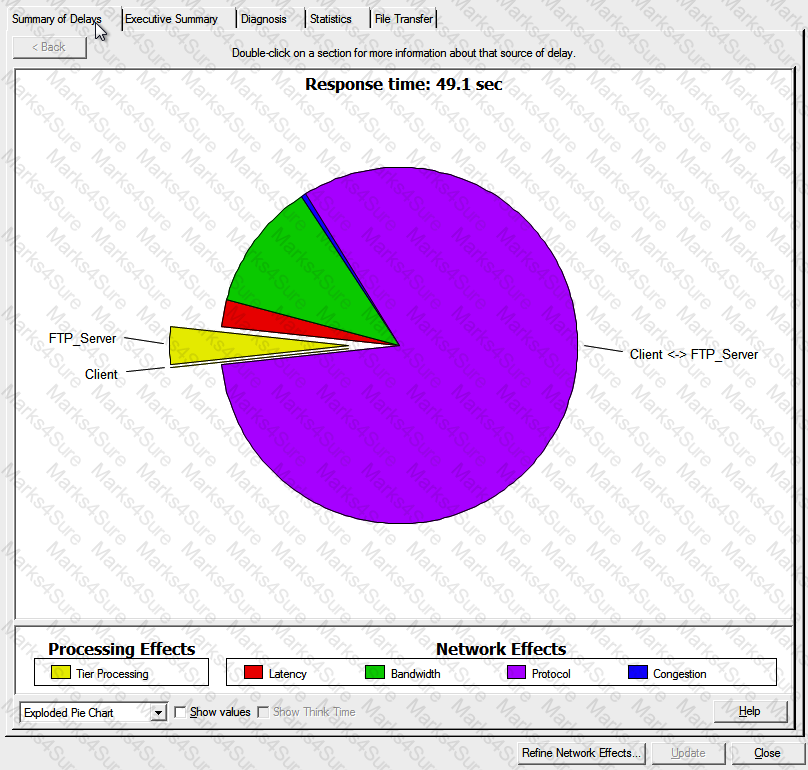
The primary bottleneck is probably due to:
PDF + Testing Engine

Testing Engine
PDF (Q&A)