Free Practice Questions for the Salesforce Tableau Data Analyst Analytics-DA-201 Exam (2026 Updated)
At Marks4sure, we are dedicated to providing IT professionals with the most accurate and reliable preparation materials for the Salesforce Analytics-DA-201 exam. To support your certification journey, we have made a selection of our premium 2026 Tableau Data Analyst practice questions and answers available completely free. You can take this practice test as many times as you need. Every question includes a detailed, expertly verified explanation to ensure you fully grasp the core security concepts before test day.
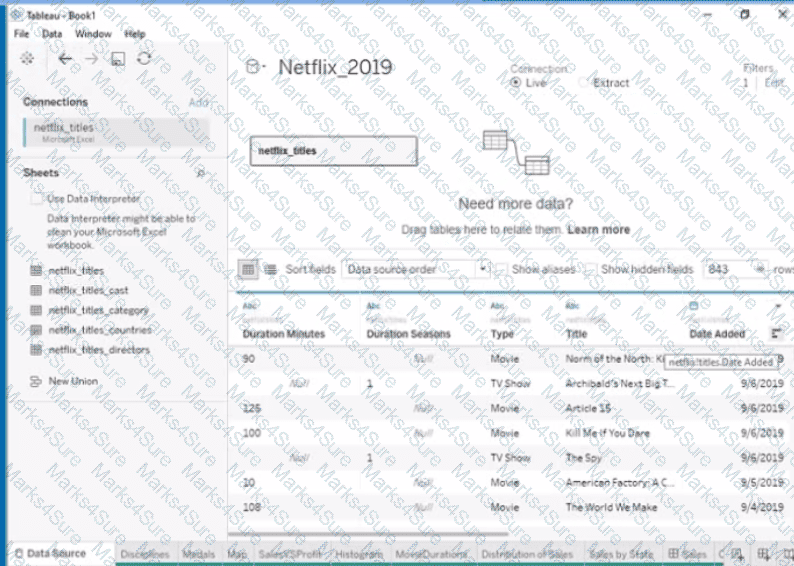
You want to connect a Tableau workbook to a dataset in a Microsoft Excel spreadsheet.
What should you do from Tableau Desktop?
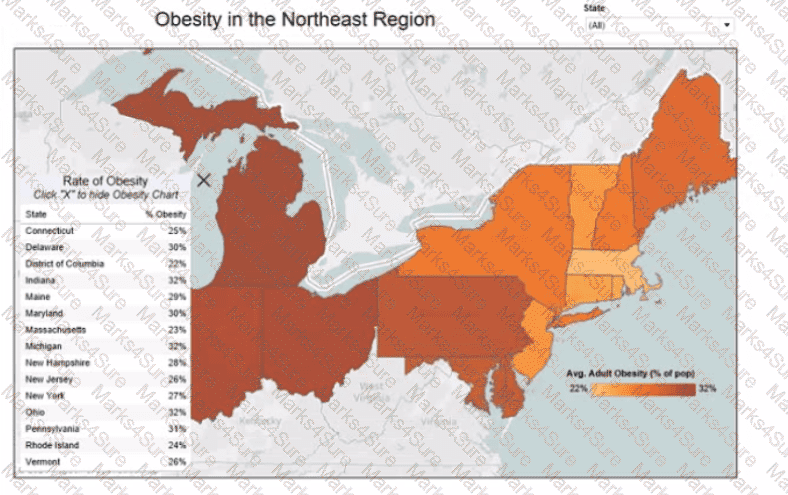
You have the following dashboard that contains two visualizations.
You want to show only one visualization at time. Users must be able to switch between visualizations.
What should you me?
You have the following line chart that shows the average sales by month.
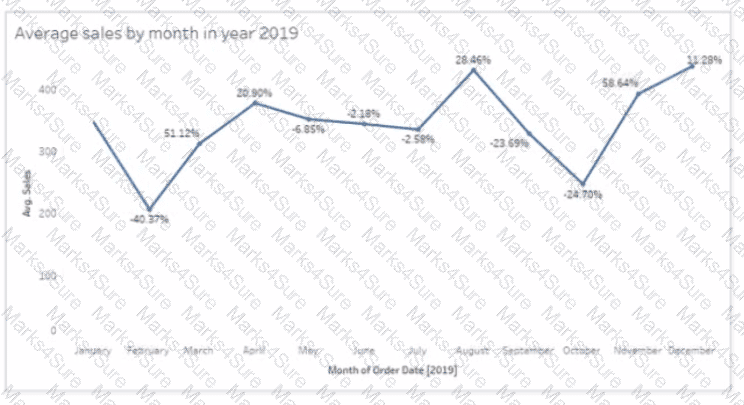
Which month had the biggest increase in swage sales compared to me previous month in 2019?
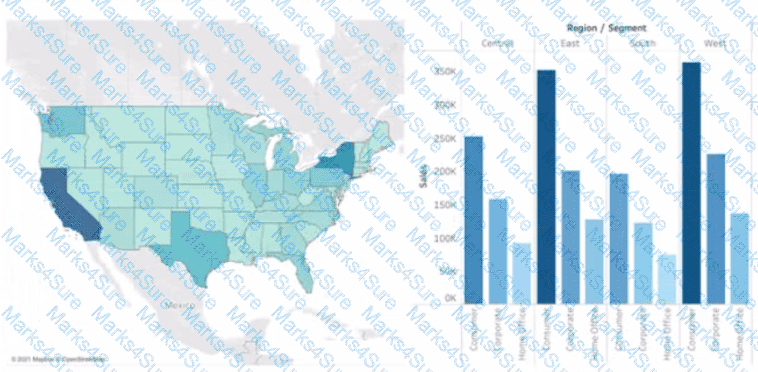
You have the following box plot that shows the distribution of average profits made in every state by region.
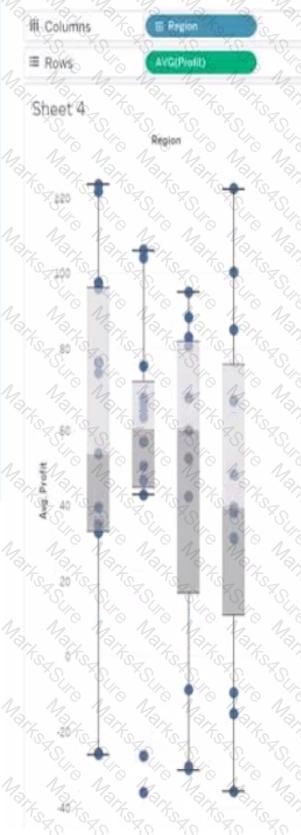
Which region has the smallest distribution of profits?
Open the link to Book1 found on the desktop. Use the Superstore data source.
Split the Customer Name field into two fields named First Name and Last Name.
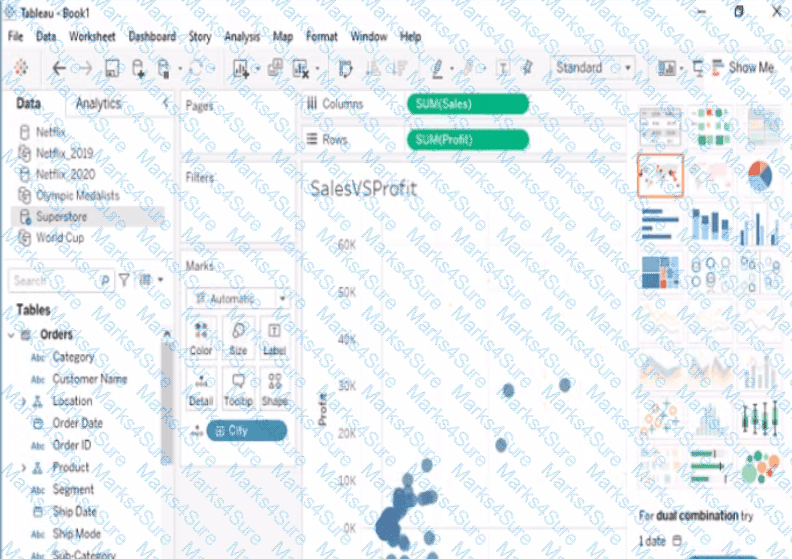
Open the link to Book1 found on the desktop. Open SalesVSProfit worksheet.
Add a distribution band on Profit to show the standard deviation from- 1 to 1.
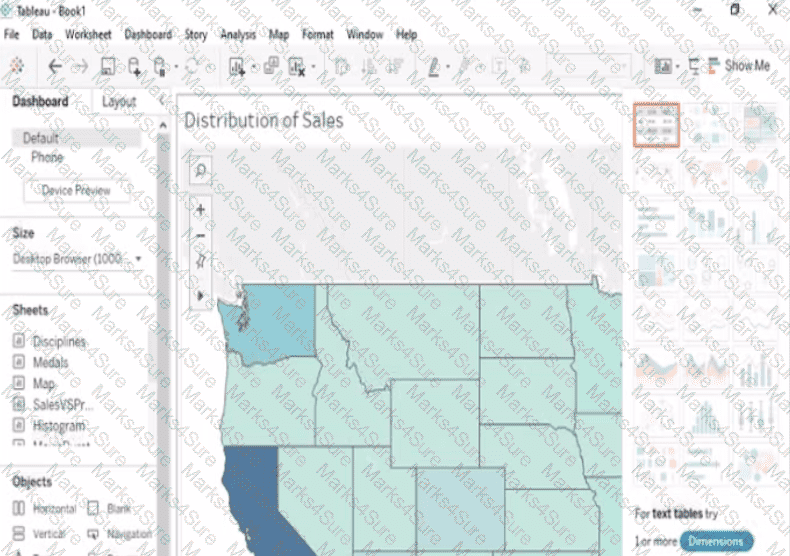
Open the link to Book1 found on the desktop. Open the sales dashboard.
Add the Sales by State sheet in a Show/Hide button to the right side of the dashboard.
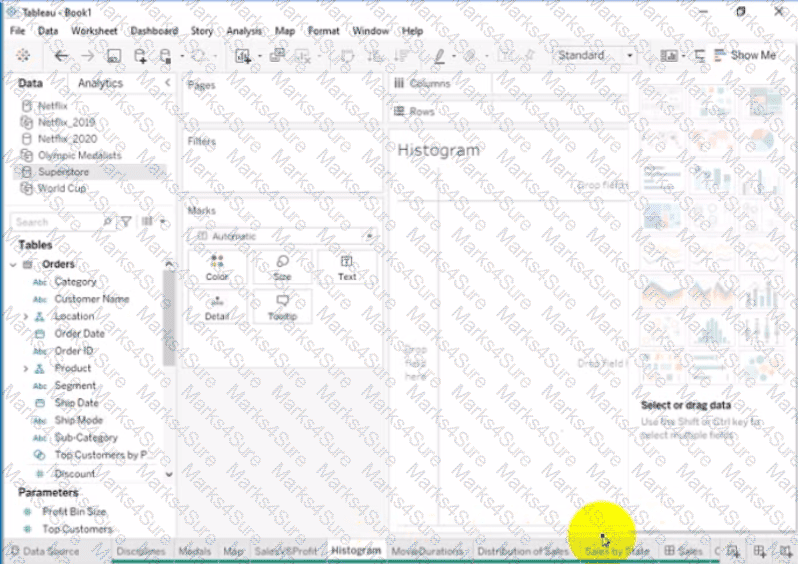
Open the link to Book1 found on the desktop. Open the Histogram worksheet and use the Superstone data source.
Create a histogram on the Quantity field by using bin size of 3.
Open the link to Book1 found on the desktop. Open the Movie Durations worksheet.
Replace the existing data source with the Netflix_2019 data source.
Open the link to Book1 found on the desktop. Open the CategoryPercentage worksheet.
Modify the bar chart show the percentage of sales for each Subcategory within every Category. The total percentage for every Category must be 100%.

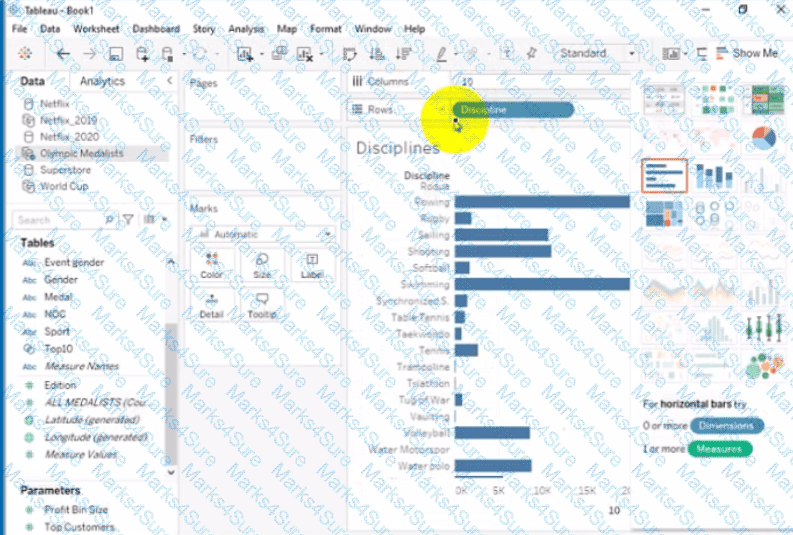
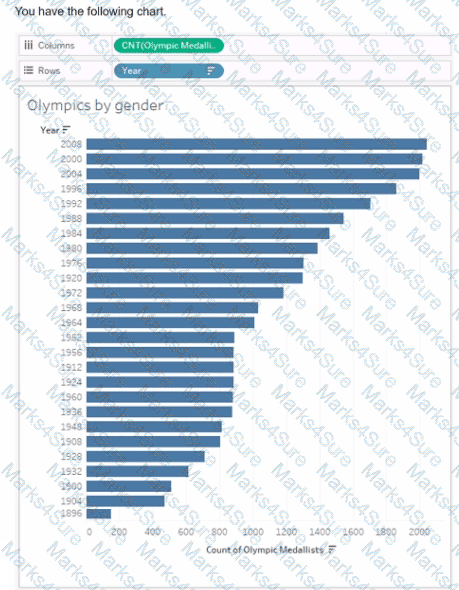
Open the link to Book1 found on the desktop. Open Disciplines worksheet.
Filter the table to show the Top 10 NOC based on the number of medals won.
Open the Link to Book1 found on the desktop. Open Map worksheet and use Superstore data source.
Create a filed map to show the distribution of total Sales by State across the United States.
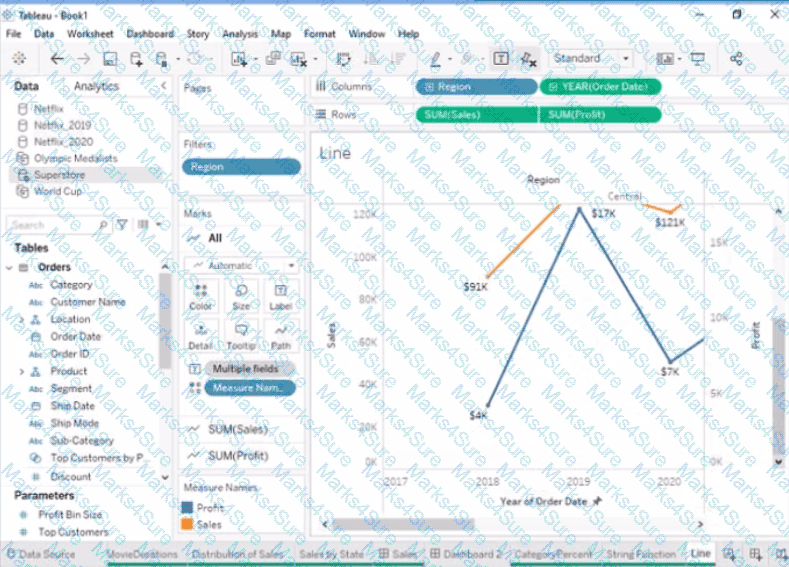
Open the link to Book1 found on the desktop. Open the Line worksheet.
Modify the chart to show only main and max values of both measures in each region.
Open the link to Book1 found on the desktop. Open Disciplines worksheet.
Filter the table to show the members of the Top10 set and the members of the Bottom10 set. There should be a total of 20 rows.
You have the following chart that shows the cumulative of sales from various dates.
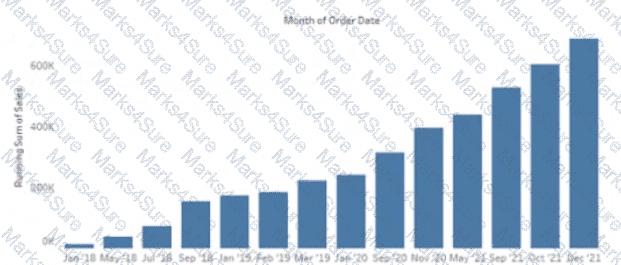
You want the months to appear as shown in the following chart.
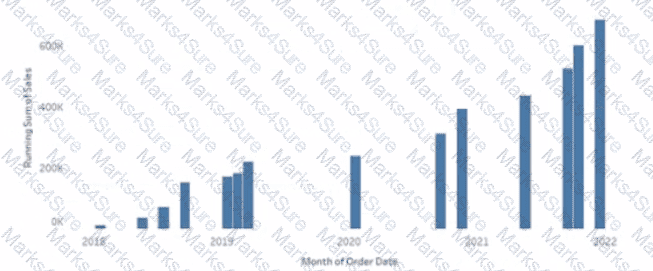
What should you do?
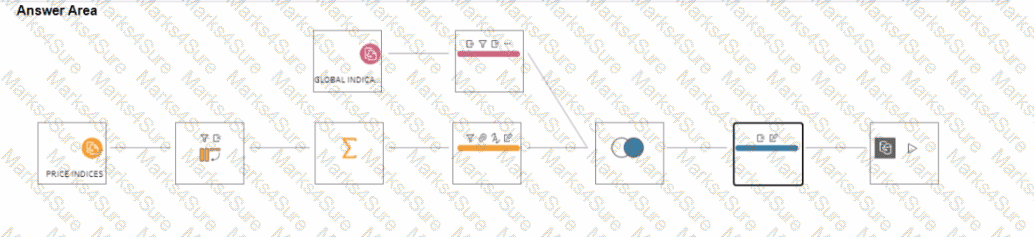
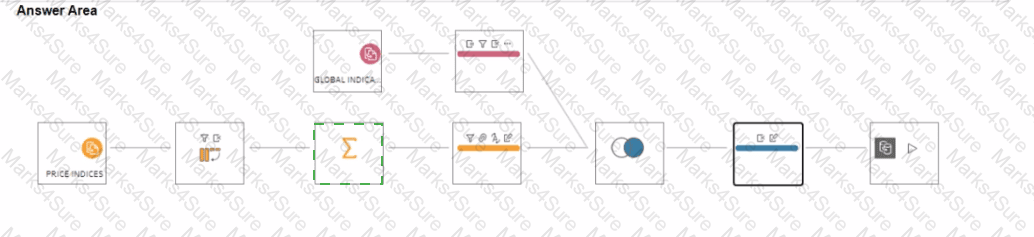
You have a Tableau Prep flow that joins a dataset named Global Indicators to a dataset named Price Indices.
In which step can you transform rows of monthly data into rows of yearly data ' '
You have the following visualization.
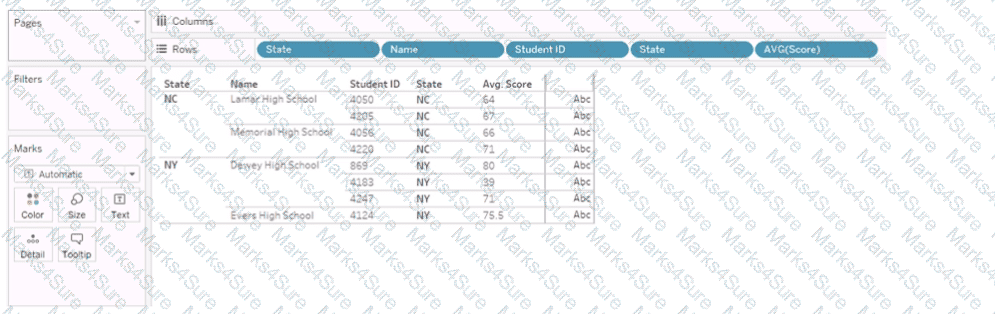
You Create a table calculation named Rank_Score that has a formula of RANK(AVG([Score]), and you drag Rank_Score to Text on the Marks cards.
What is the Rank Score value for Student ID 4220?
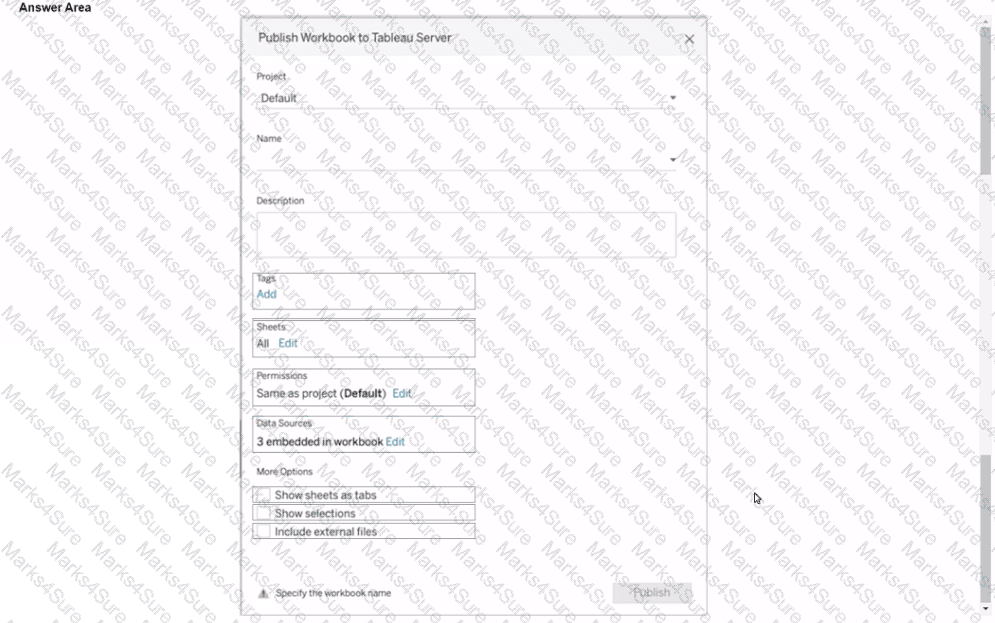
You plan to publish a workbook to Tableau Server.
You want to ensure that users can see other published dashboards from their current dashboard.
Which setting should you configure? (Click the appropriate Option in the Answer Area.)

A Data Analyst needs to calculate the percent of regional sales that each state contributes to. As a first step, the analyst needs to calculate total sales per region.
Which calculation should the analyst use to do this?
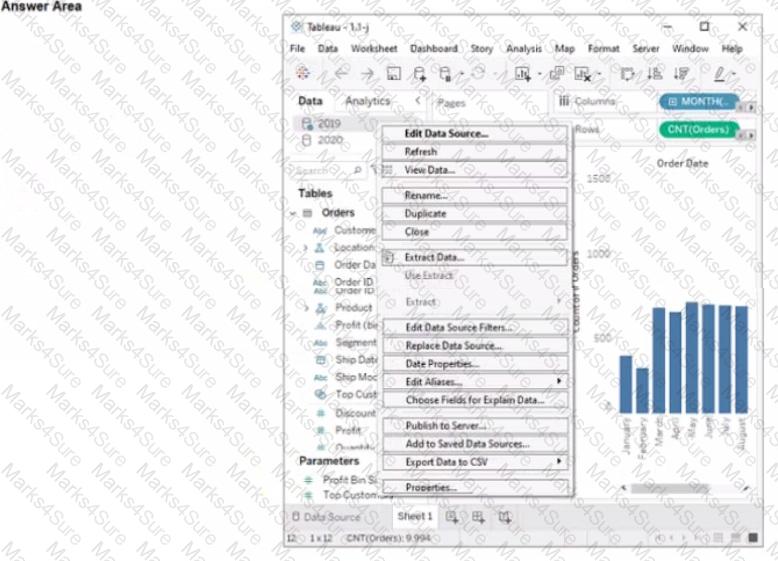
You have two data sources that use the same schema One data source contains order data from 2019 and the other data source contains order data from 2020.
You have a worksheet that shows the orders from 2019.
You need to configure the worksheet to show the orders from 2020 without reloading the data.
Which option should you select?

You have a dashboard that contains a parameter named Start Date.
You need to create an extract from a Microsoft Excel file. The extract must be filtered based on Start Date.
What should you do?
in which three formats can you export a worksheet from the Worksheet menu? Choose three
You have a sales dataset that contains the following fields.
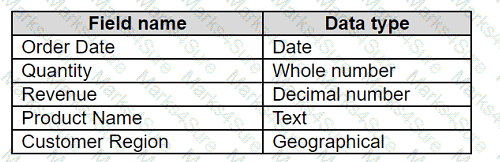
You need to analyze the average revenue per product in different regions over time.
Which two fields should be measures? Choose two.
A Data Analyst has the following chart.
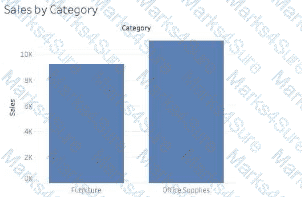
The analyst needs to enable the drilldown from Category to Subcategory as shown in the following chart.
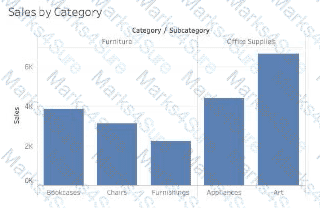
What should the analyst create?
A Data Analyst at a coffee company has the following visualization already built.
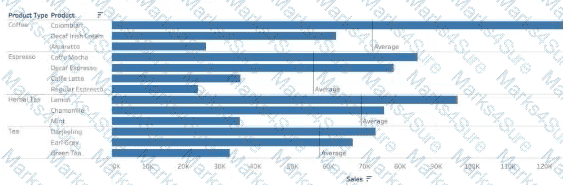
The analyst wants to make this more visually appealing by coloring the bars based on whether they are above or below the Average Sales within each Product Type.
Which calculation should the analyst use to calculate the Average Sales for each Product Type?
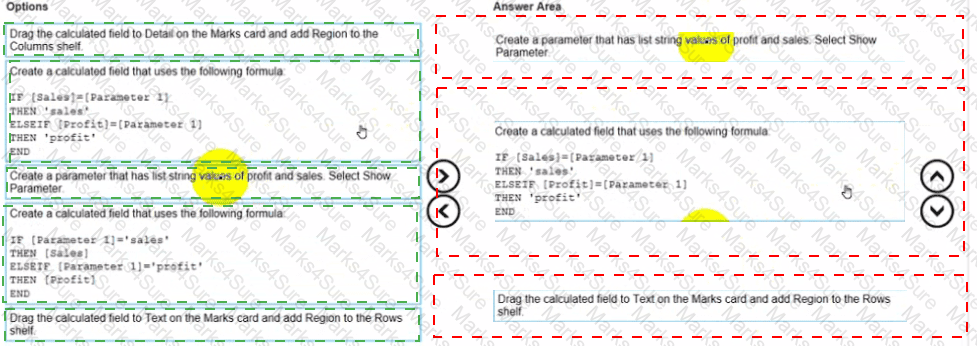
You need the top 10 values to appear in a different color. The lop 10 values must be colored dynamically.
What should you do?
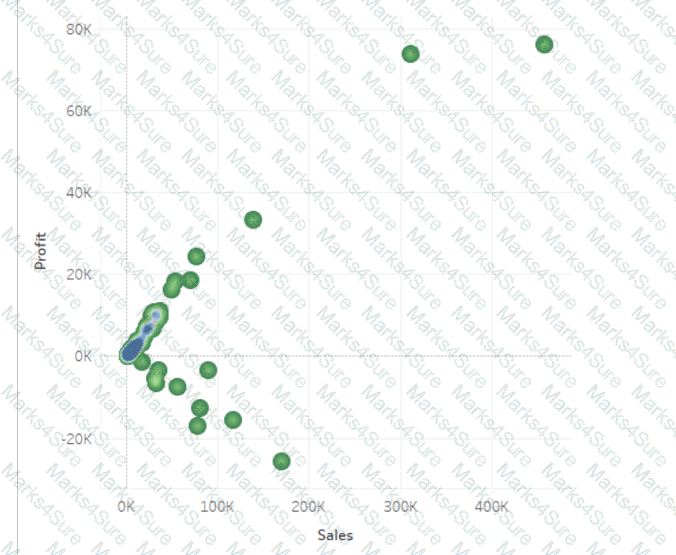
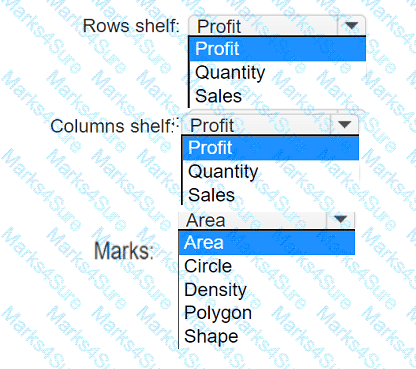
You have a data set that contains three columns named Sales, Profit, and Quantity.
You need to build the following scatter plot.

You subscribe to a view that delivers a daily email to your inbox.
You want to make the subscription available to other stakeholders.
What should you do?
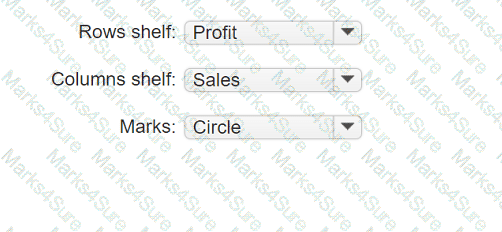
You have the following Map.
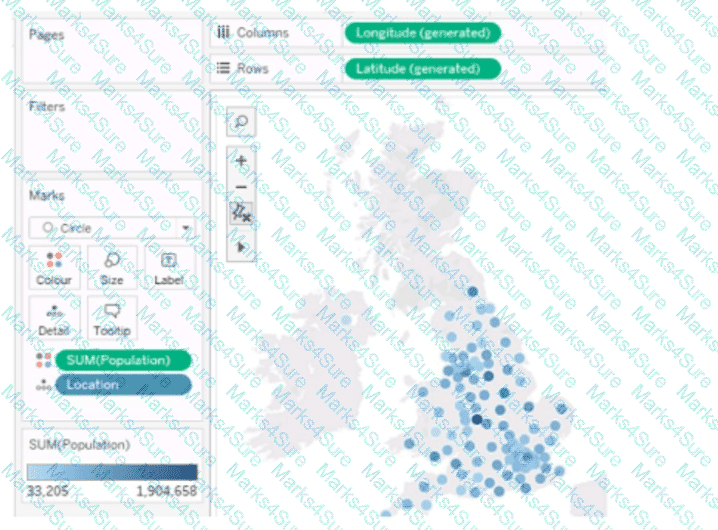
You need the map to appear as shown in the following visualization.
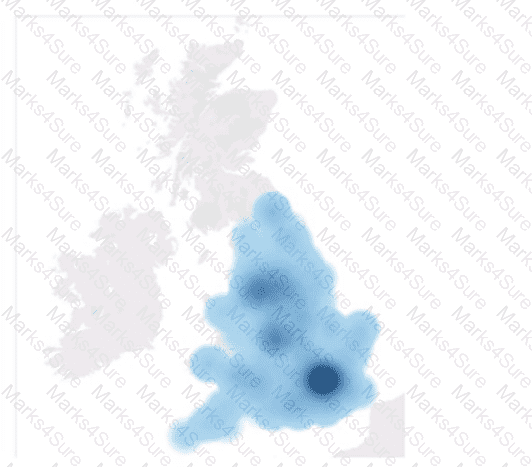
What should you do?
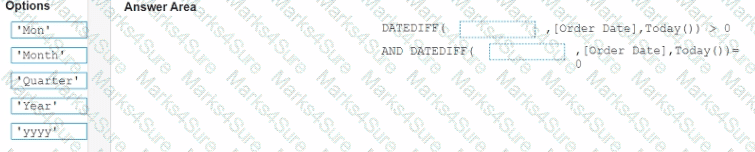
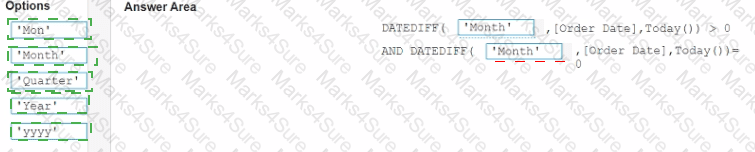
In a worksheet, you have a calculated column named YTD Sales that uses the following formula.
[Order Date] < = TODAY () AND DATETBUNC {“year”, [Order Dace]) = DATETPUNC) " year " , TODAY(J)
You want to create a calculated column named Exclude Current Month that will be dragged to the Filters shell. Exclude Current Month will exclude the current month values from YTD Sales.
How should you complete the formula for Exclude Current Month? (Drag the appropriate Options to the Answer Area and drop into the correct locations.)
You are developing a data source in Tableau Prep.
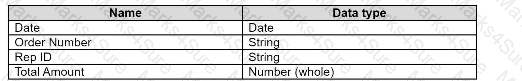
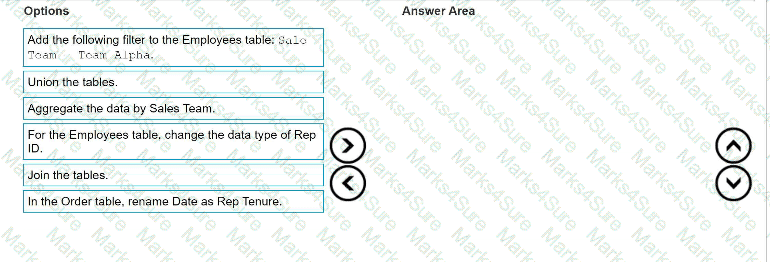
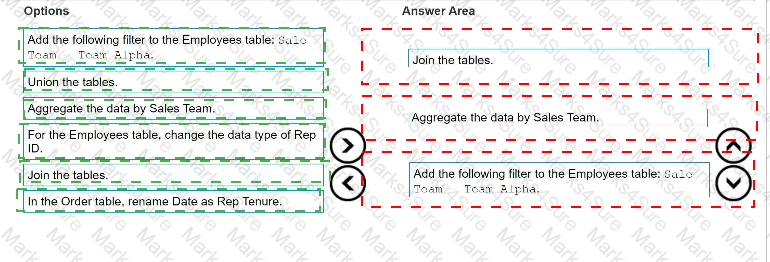
You have two tables named Orders and Employees.
The Orders table was created in 2019 and contains the following columns.
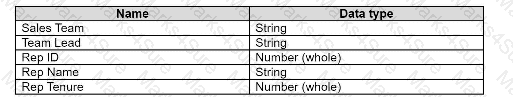
The Employees table contains all the employee information for the various sales teams in the sales department and contains the following columns
You want to prepare the data so that you can analyze sales trends over time for every sales team.
Which three actions should you perform in order? (Place the three correct options in order. Use the arrows to move Options to Answer Area. Use Answer Area arrows to re-order the options.)
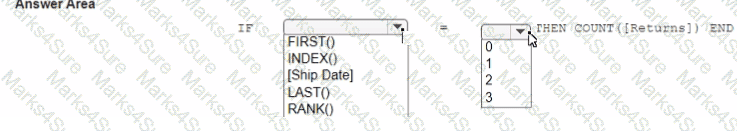
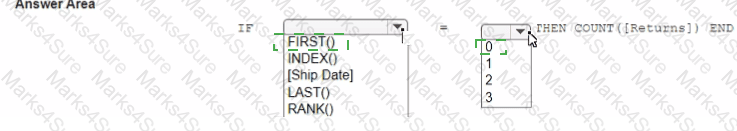
You have the following visualization.
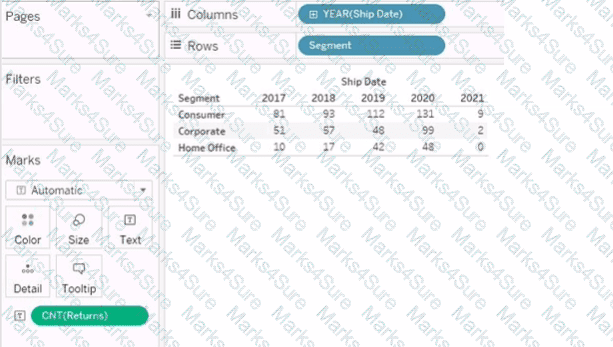
You want the count of Returns displayed only for the first year in the table.
How should you complete the formula in the calculated field? (Use the dropdowns in the Answer Area to select the correct options to complete the formula.)
PDF + Testing Engine

Testing Engine
PDF (Q&A)