
Free Practice Questions for the WGU Courses and Certificates Applied-Algebra Exam (2026 Updated)
At Marks4sure, we are dedicated to providing IT professionals with the most accurate and reliable preparation materials for the WGU Applied-Algebra exam. To support your certification journey, we have made a selection of our premium 2026 Courses and Certificates practice questions and answers available completely free. You can take this practice test as many times as you need. Every question includes a detailed, expertly verified explanation to ensure you fully grasp the core security concepts before test day.
The graph shows the progress of a manufacturing team, modeling the number of widgets the team is able to produce each day since the team was formed.
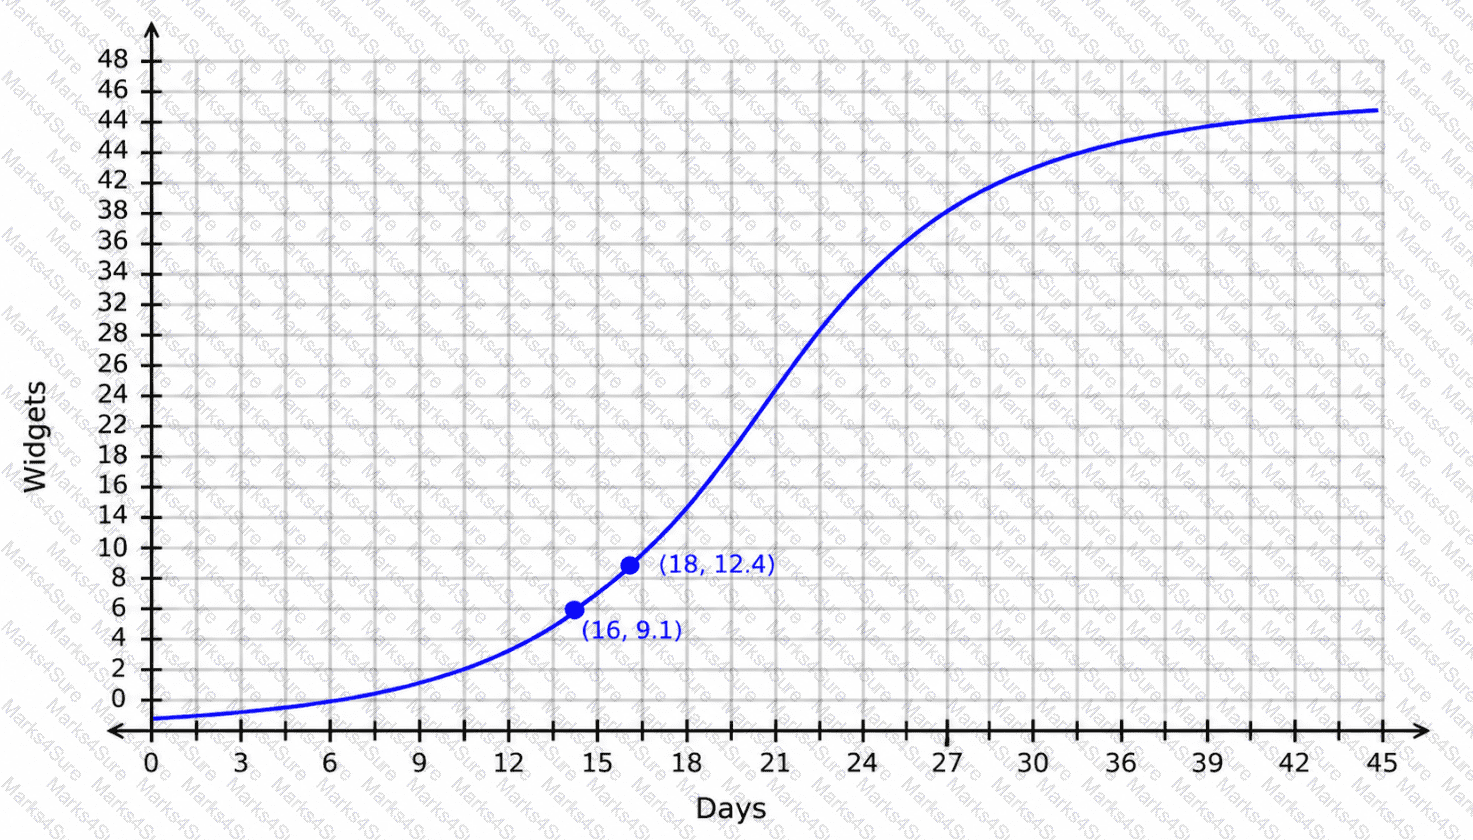
How should the average rate of change from day 16 to day 18 be interpreted?
The number of property sales in a region this year is expected to be 9 more than the number of property sales in the region last year. The function H(x) represents the number of property sales this year, where x represents the number of properties sold last year.
Which notation represents the number of property sales this year, given that the number of properties sold last year was 140?
The graph shows the number of customers visiting a bookstore, where the number of days since the beginning of the month is along the horizontal axis and the number of customers visiting the bookstore each day is along the vertical axis. More customers show up to the store on days when new releases are featured than on other days.
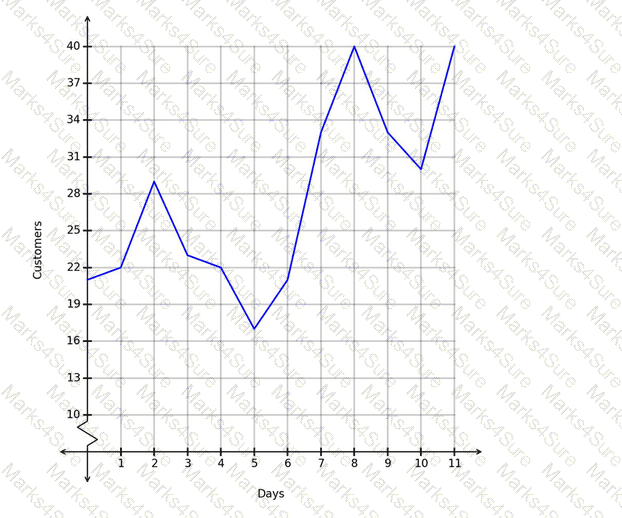
Which days likely featured new releases?
A researcher collected data on the number of members in a national association over time. The results are shown in the scatterplot. The graphed regression function has an r^2value of 0.54.
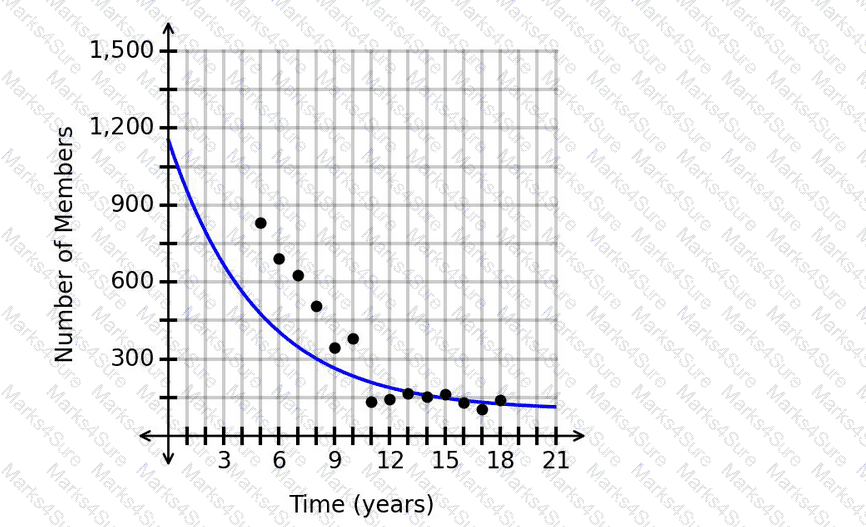
Is it appropriate to make a prediction for the number of members after 20.6years?
The data in the scatterplot represents the number of monthly train crossings at a particular intersection over time.
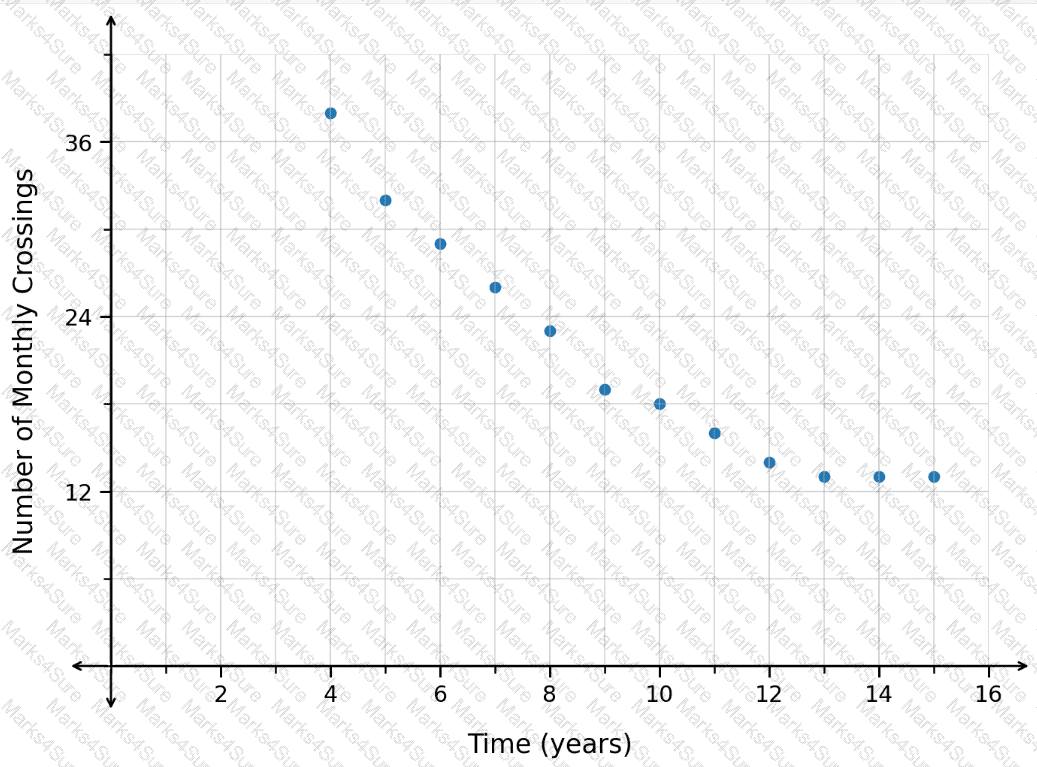
Which type of function should be used to model the data?
A music student attempted to learn a difficult new song. Each day, the student would play the song and be scored on their performance. The graph shows the results.
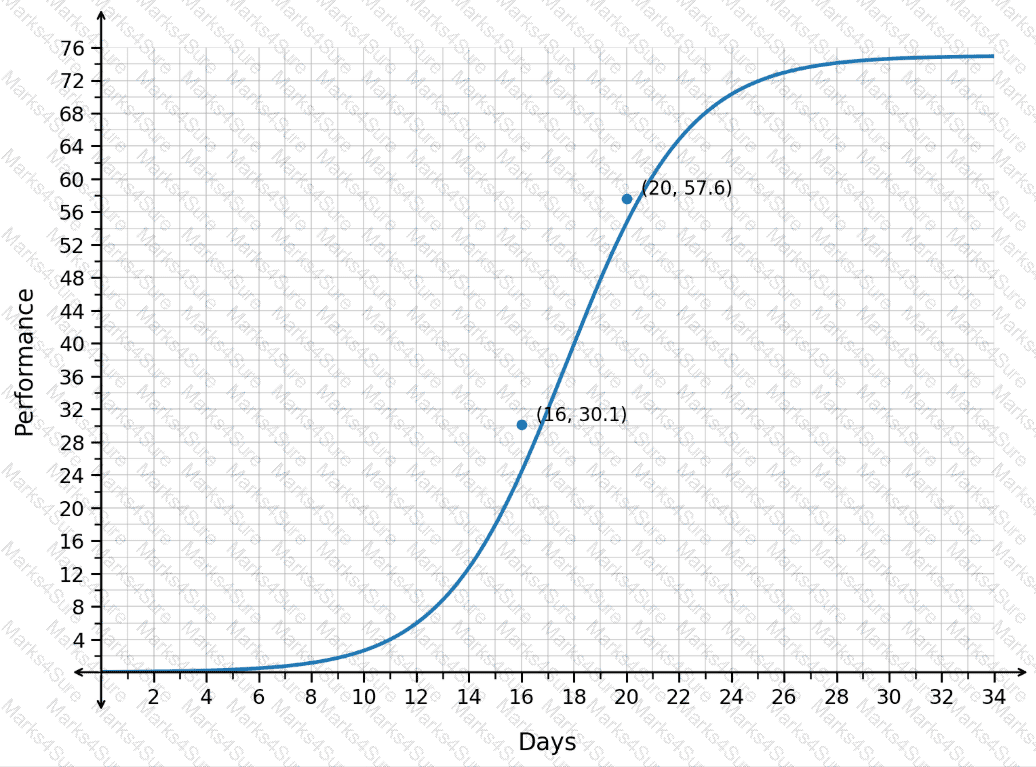
What was the average daily change in performance from day 16 to day 20?
In the graph showing the number of new customer accounts, the horizontal axis shows the number of weeks since the beginning of winter and the vertical axis shows the number of new customer accounts. More customer accounts are opened during snowy weeks than during weeks without snow.
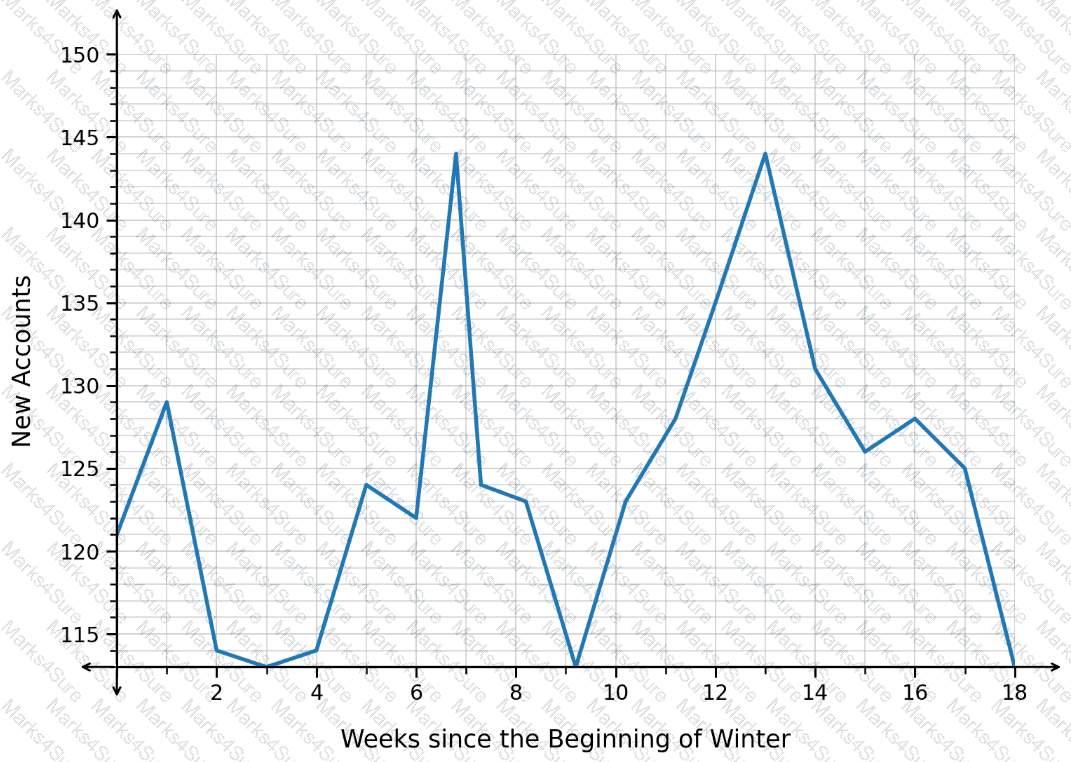
When was it likely snowy?
The function P(t)represents the yearly profit, in millions of dollars, for a streaming service since opening. The graph of P(t)is shown.
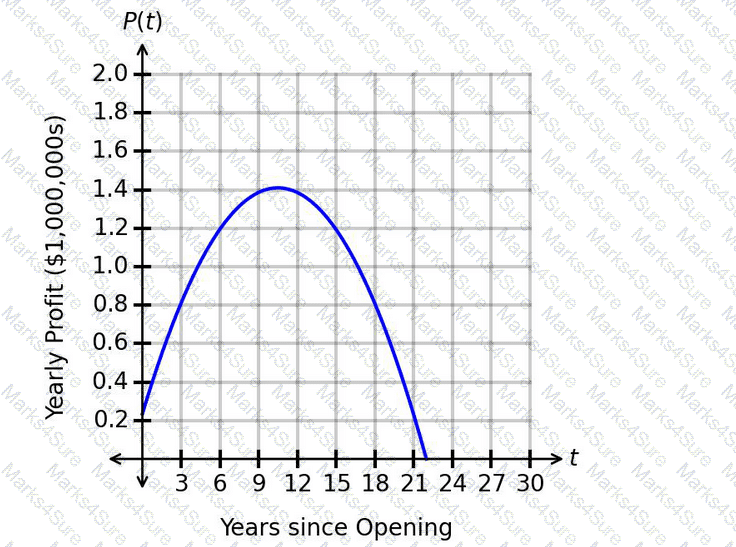
What is the correct interpretation of the maximum value?
The logistic function f(x), whose graph is shown, models the number of people with a viral infection, where x represents the number of days since the outbreak of the virus and f(x) represents the number of viral infections.
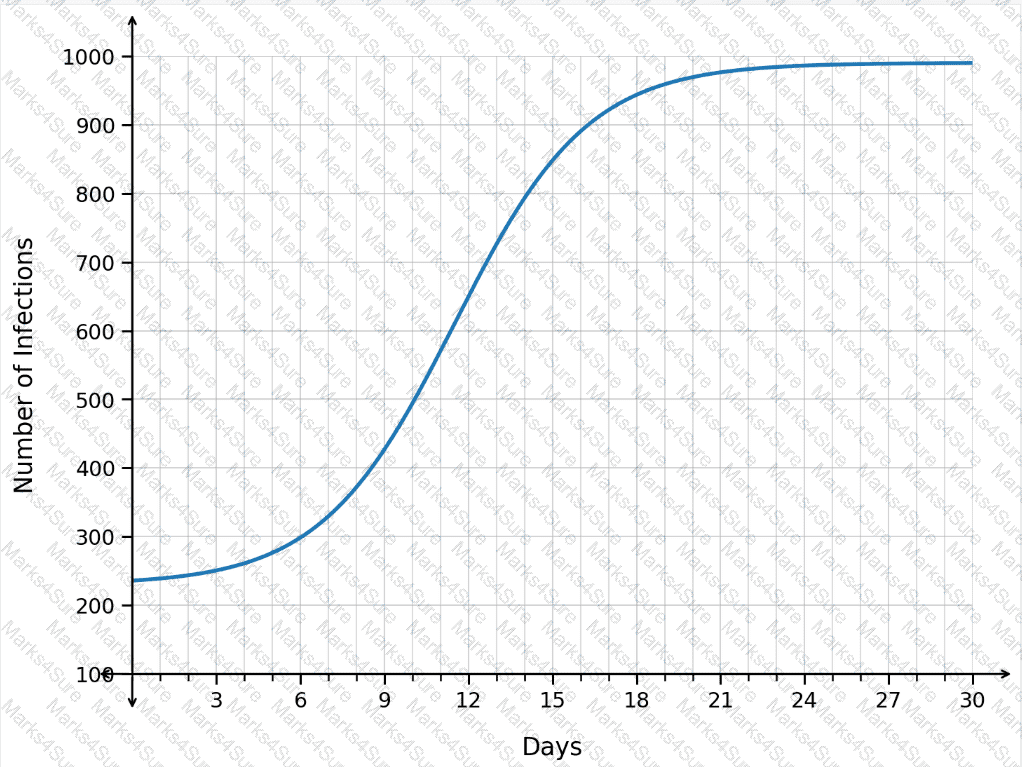
What happens as time progresses from day 9 to day 12?
The populations, in thousands, of two towns are shown in the graph, where the horizontal axis measures the time in years.
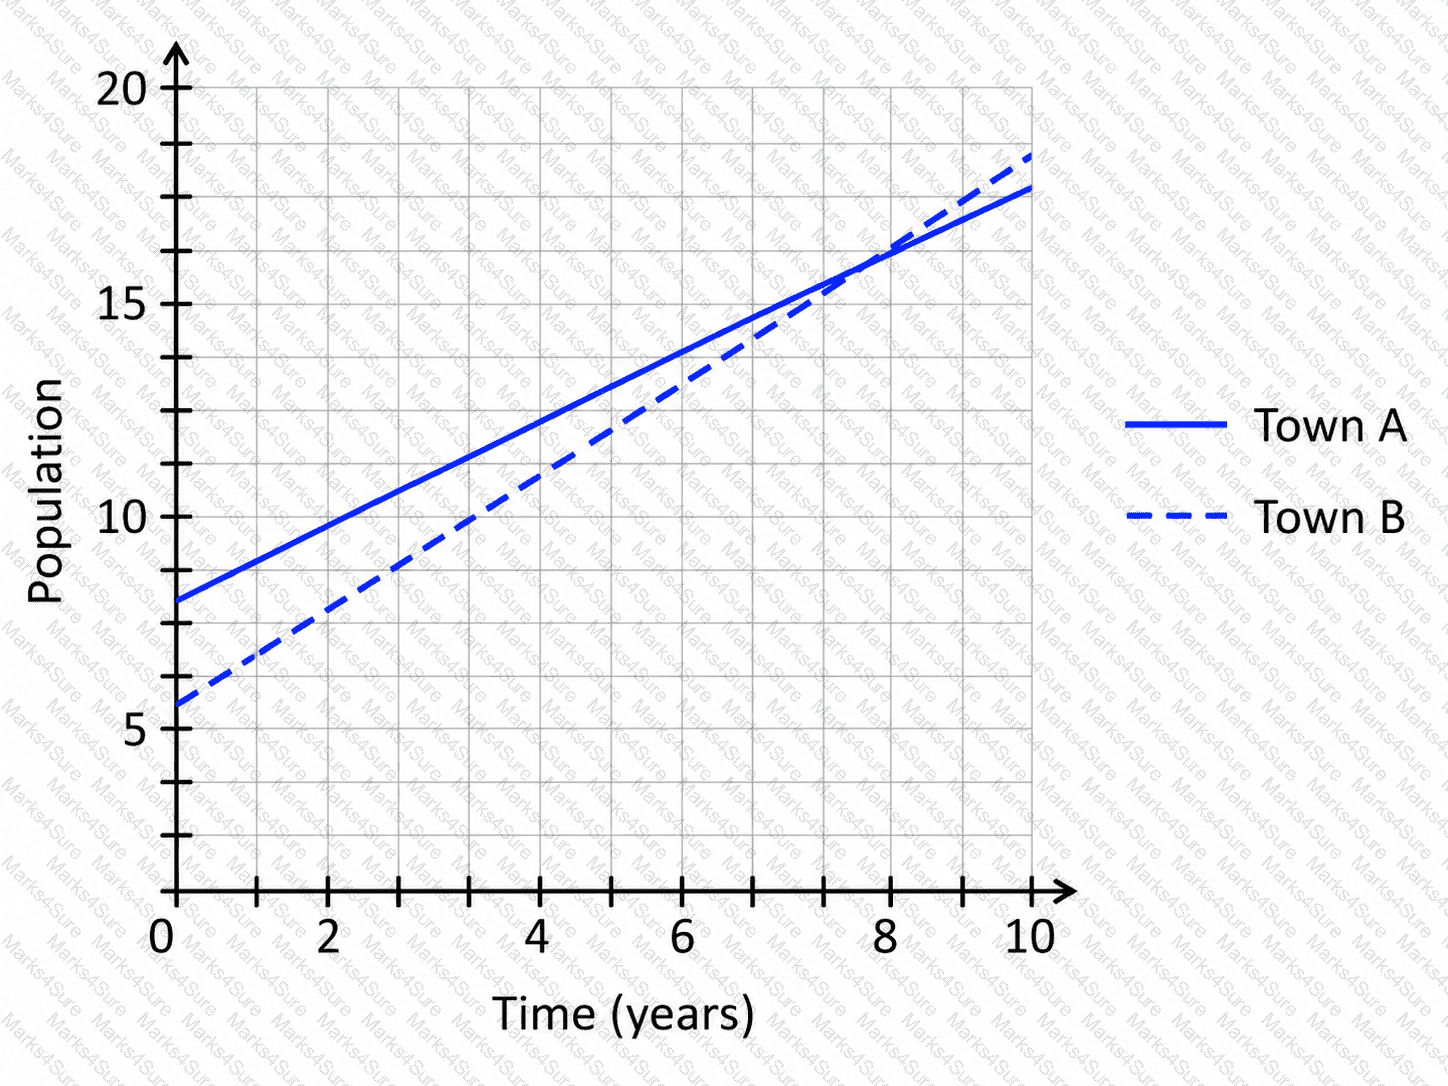
Which town’s population is growing at a faster rate?
An investment account accrues interest every year, and the value of the account is given by G(x). The graph of this function is shown.
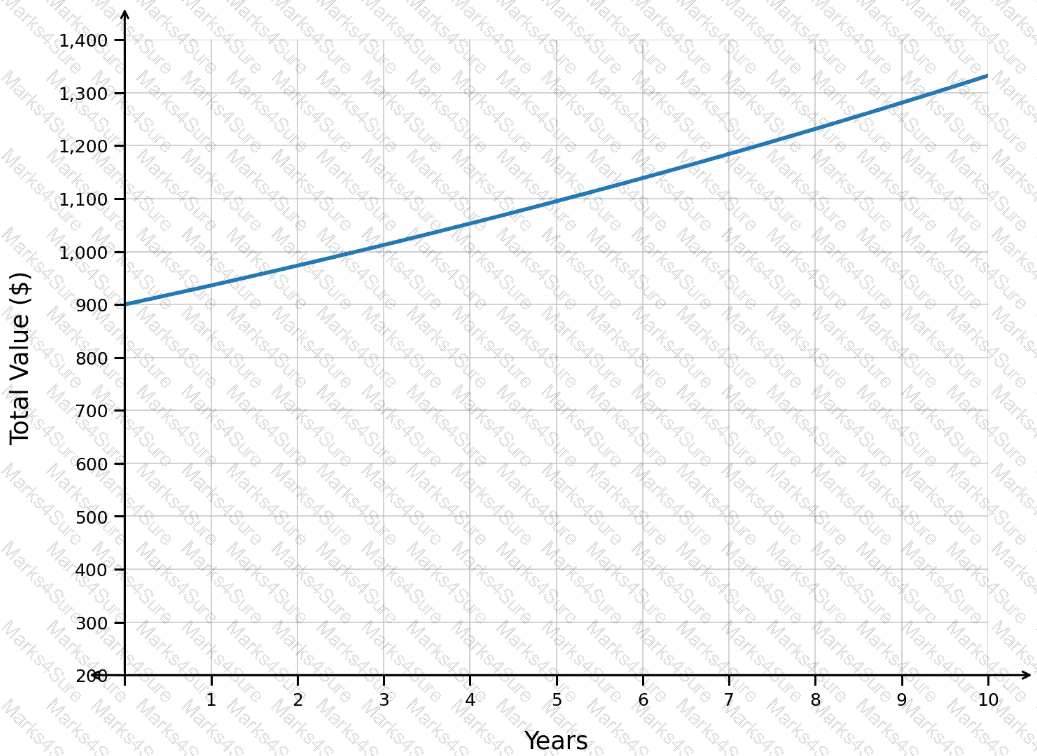
What represents the value of the account after 4 years?
The function d(x)=14+65xrepresents the distance, in meters, from a tower to an object at time x, in seconds.
What is the value of d(1.5)?
The value of a painting is represented by the function
f(x)=330× 〖 1.04 〗 ^x
In this function, xrepresents the number of years since 2004, and f(x)represents the value of the painting in dollars.
Which value represents the average yearly rate of change of the painting ' s value from 2013 to 2018?
The number of property sales in a region this year is expected to be 3 times the number of property sales in the region last year. The function H(x) represents the number of property sales this year, where x represents the number of properties sold last year. Which notation represents the number of property sales this year, given that the number of properties sold last year was 280?
The exponential function
f(t)=2900(1.13)
t
represents the size of a bacteria population, where t is the time in hours.
How many bacteria are in the population when t=18?
The number of comments on a social media post is represented by the logistic function f(x), whose graph is shown, where xrepresents the number of days since the post was created and f(x)represents the number of comments on day x.
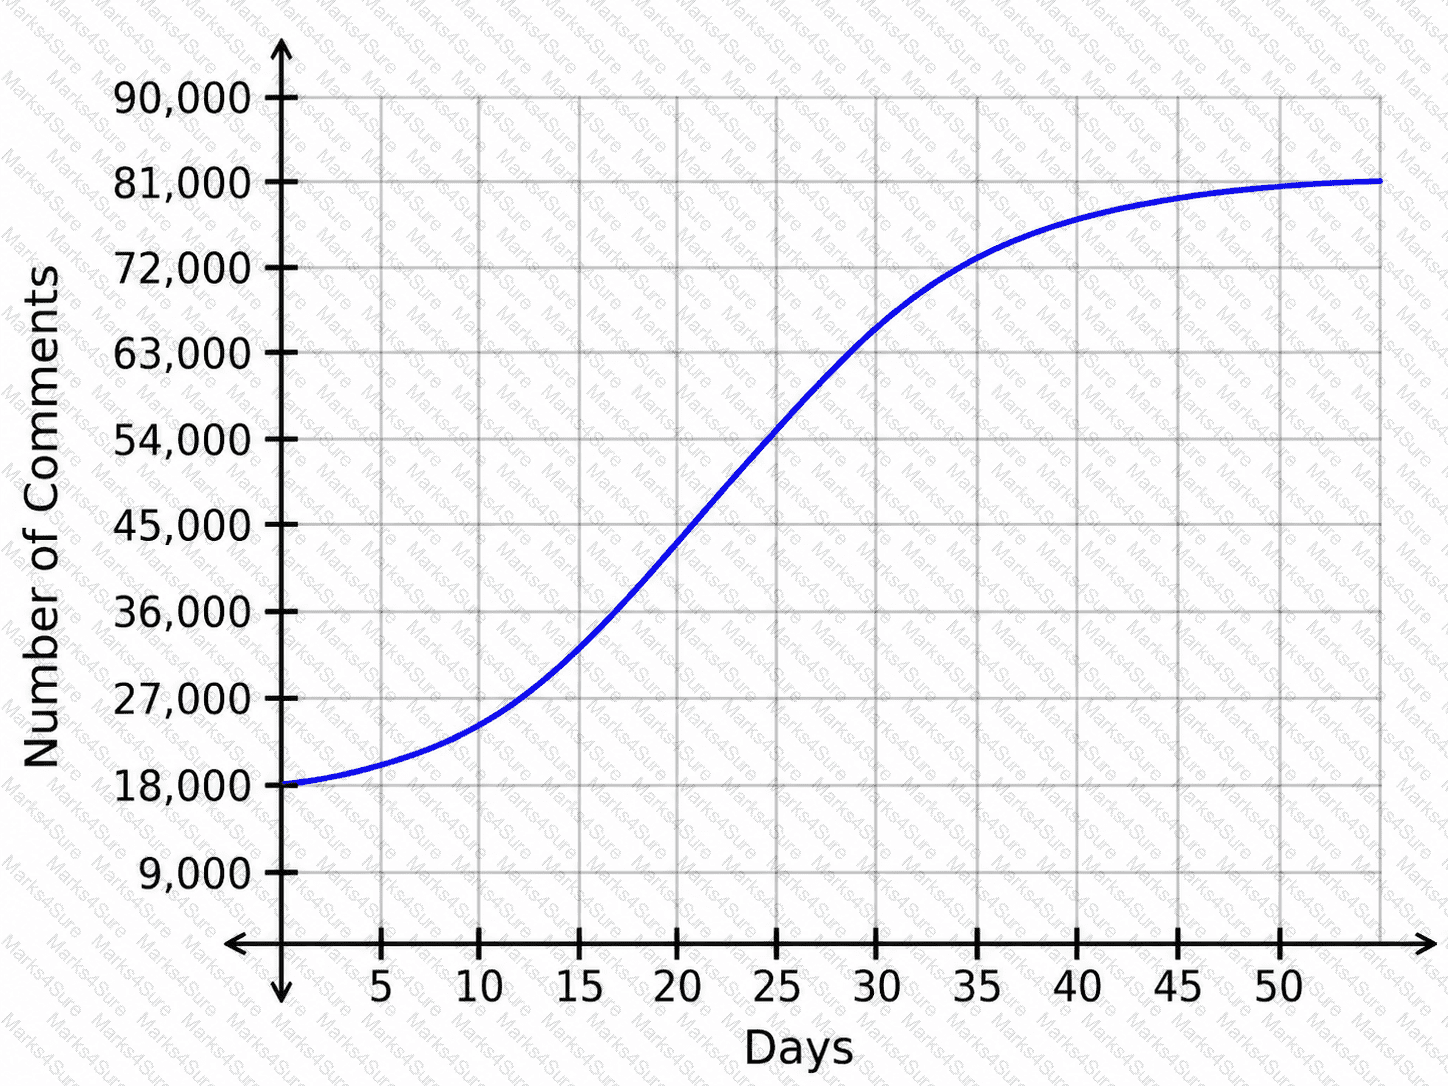
How does the number of comments change as time progresses from day 1 to day 17?
As regulations change, the number of licensed sellers of a product decreases. The graph models the change in the number of licensed sellers over time.
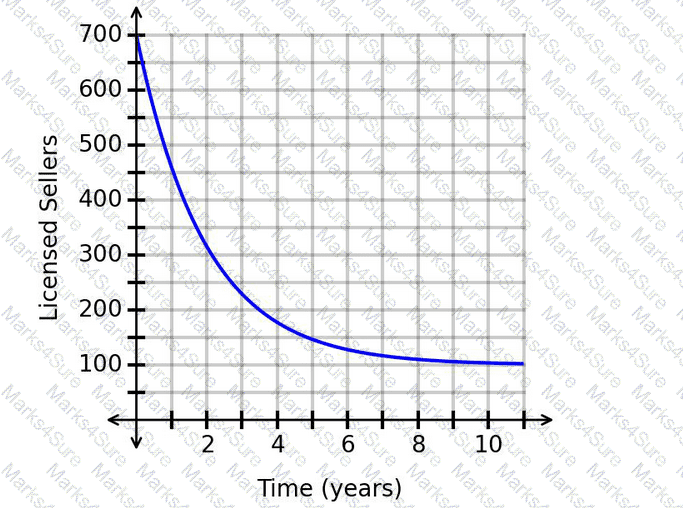
What does the horizontal asymptote mean?
The logistic function f(x), whose graph is shown, models the number of people who have created a website account, where xrepresents the number of days since the website started and f(x)represents the number of people who have created an account.
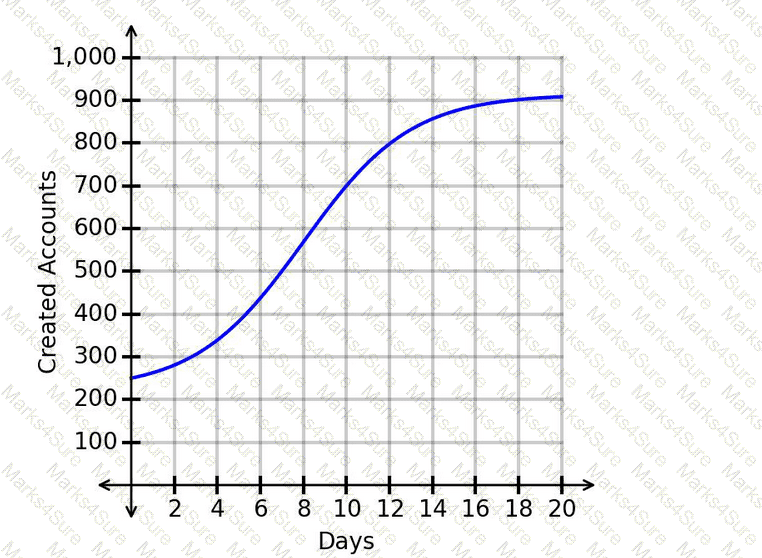
What is one range of values for which the graph is concave down?
Through a local marketplace, a person makes livestock feeders to sell. The graph shows the functions modeling the cost and revenue.
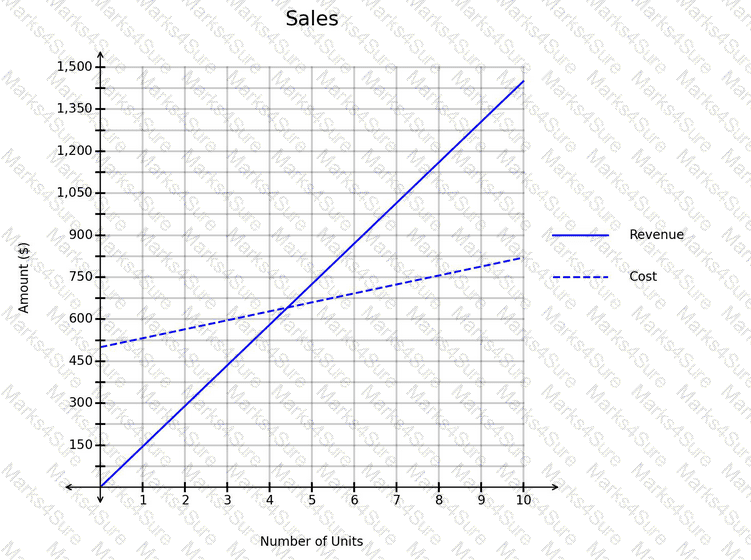
What is the minimum number of livestock feeders that must be sold in order for the revenue to cover the costs?
A new company just launched and is using the function M(t)to predict its market share after tyears. The graph of M(t)is shown.
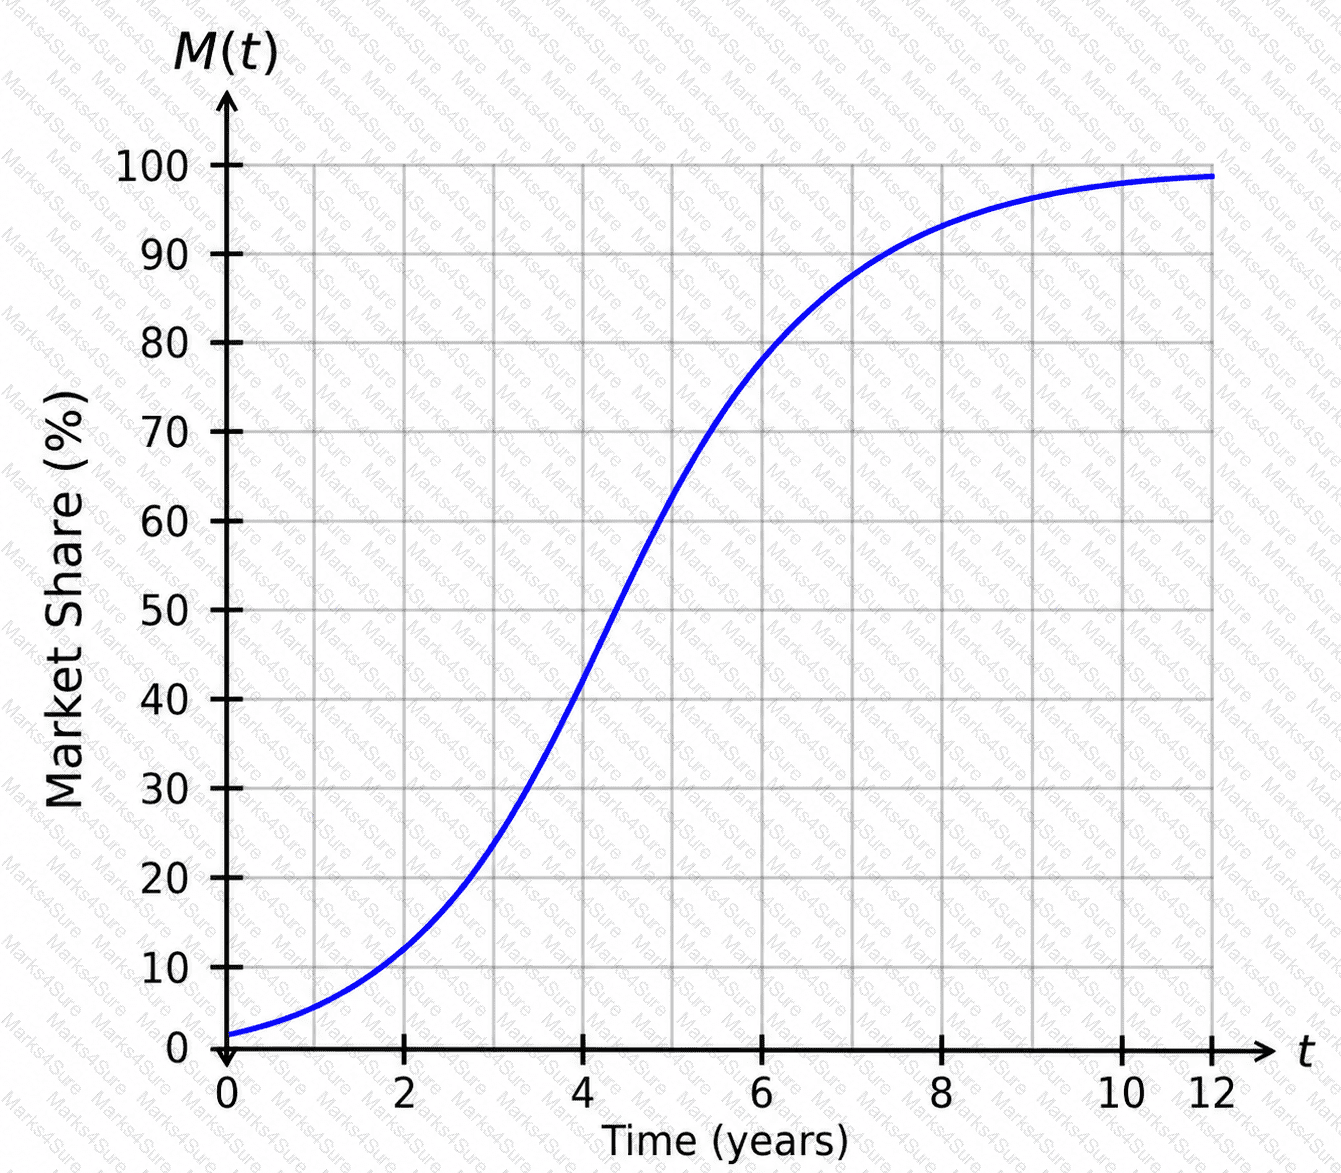
When should the company expect to have a market share of 60%?
Consider the graph of p(t)shown. The function represents the number of active players, p, in a game thours after 11:00 a.m.
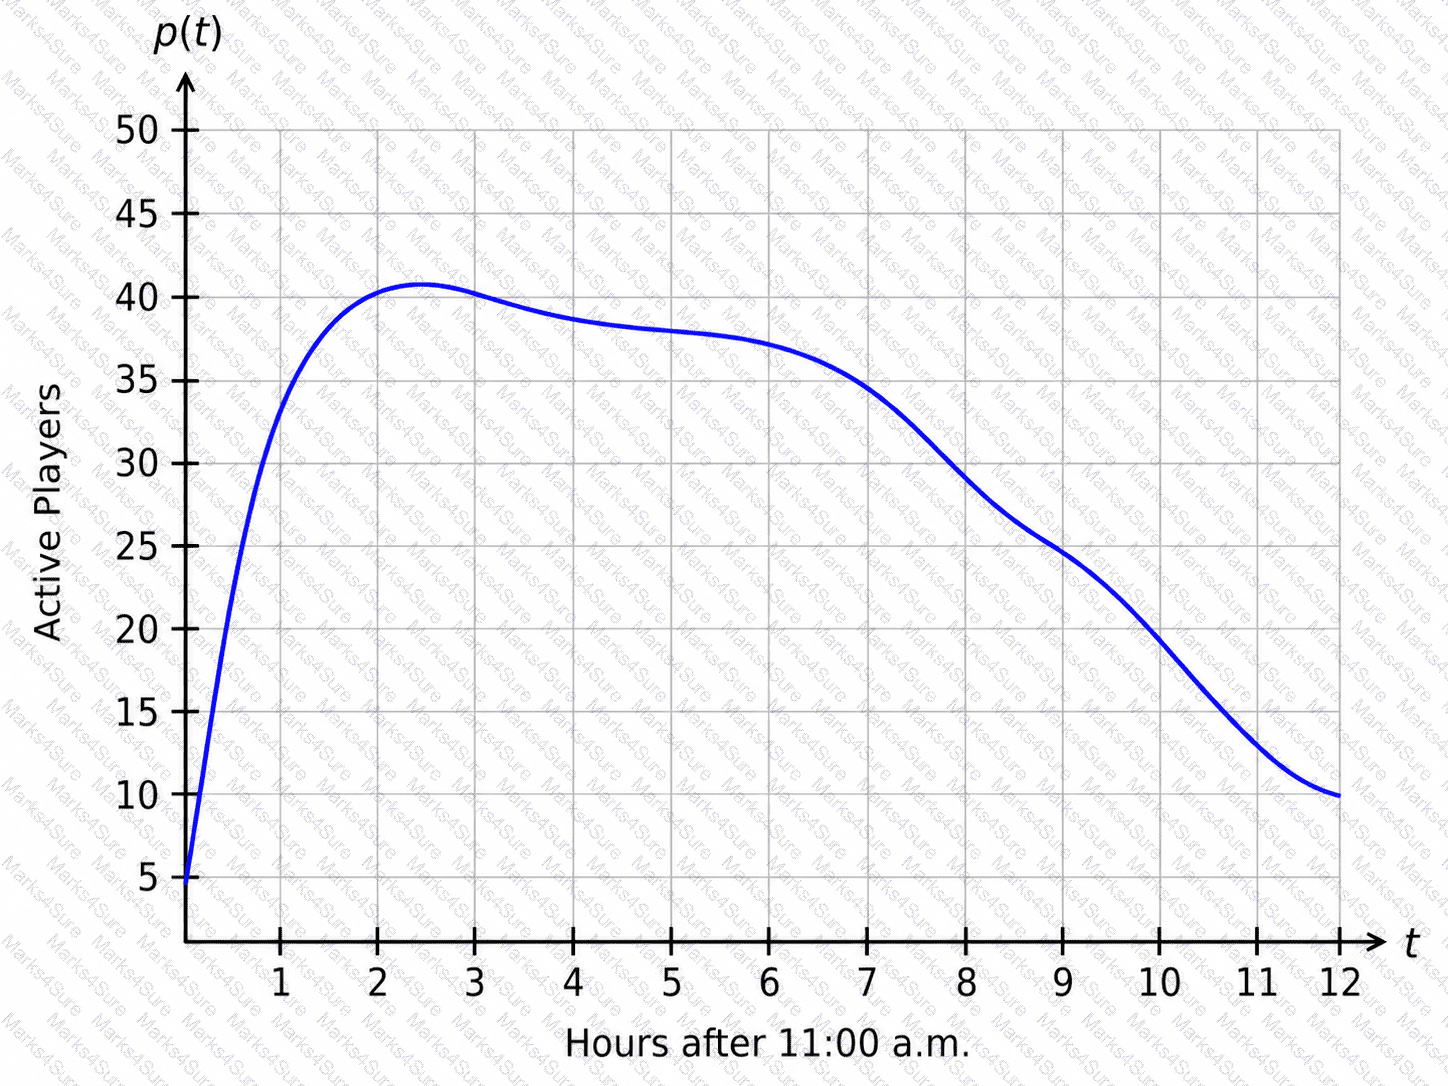
Which interpretation of the concavity between t=0.4and t=3.6is correct?
The graphed function v(t) represents the number of vehicles, v, stopped at a toll booth t hours after 6:00 a.m. The coordinates of points A and B are (1,49.4) and (4,45.8), respectively.
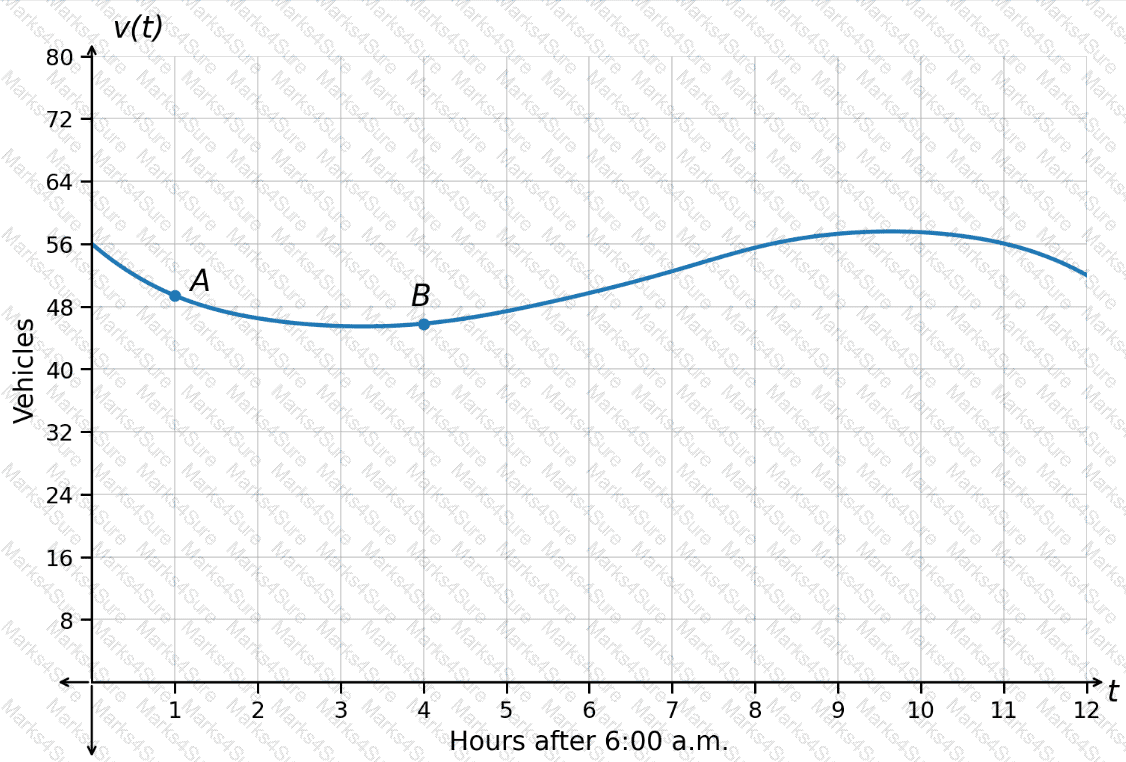
What is the average rate of change of the number of vehicles from point A to point B?
A factory mixes two colors, red and yellow, to create a dye.
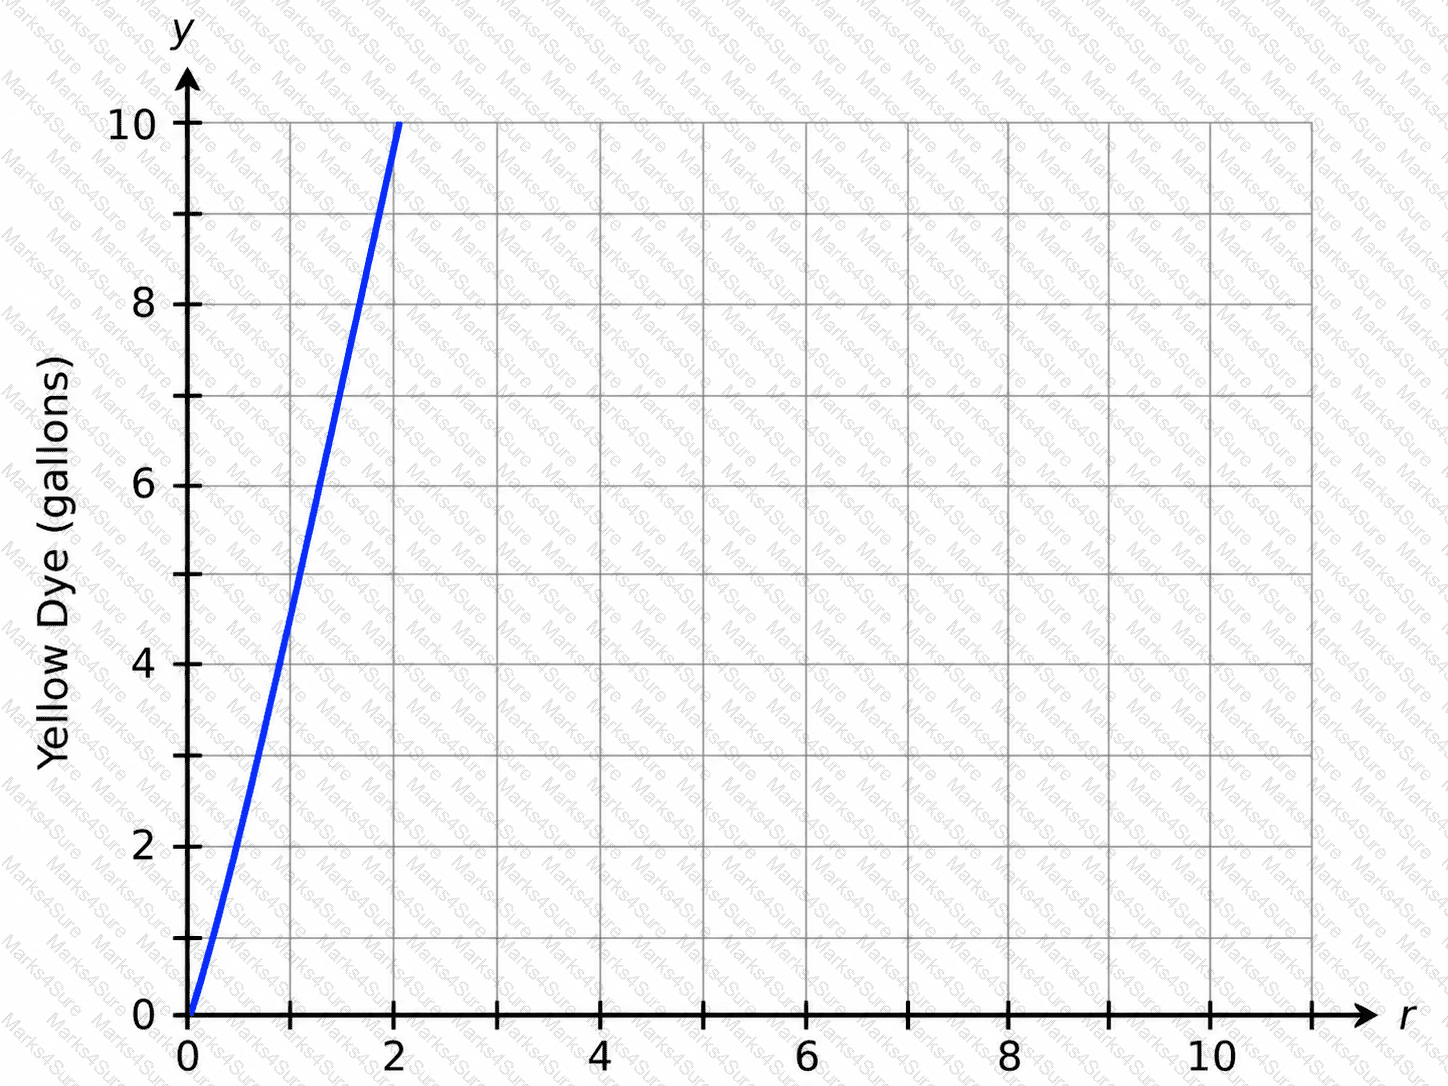
The graph shows the relationship between the amounts of each dye, where rrepresents the amount of red dye and yrepresents the amount of yellow dye.
What is the correct interpretation of the rate of change?
The value of a collectible artifact is represented by the function
f(x)=330× 〖 1.15 〗 ^x
In this function, xrepresents the number of years since 2005, and f(x)represents the value of the artifact, in dollars.
Which value represents the average yearly rate of change of the value of the artifact from 2006 to 2011?
A person makes down quilts to sell.
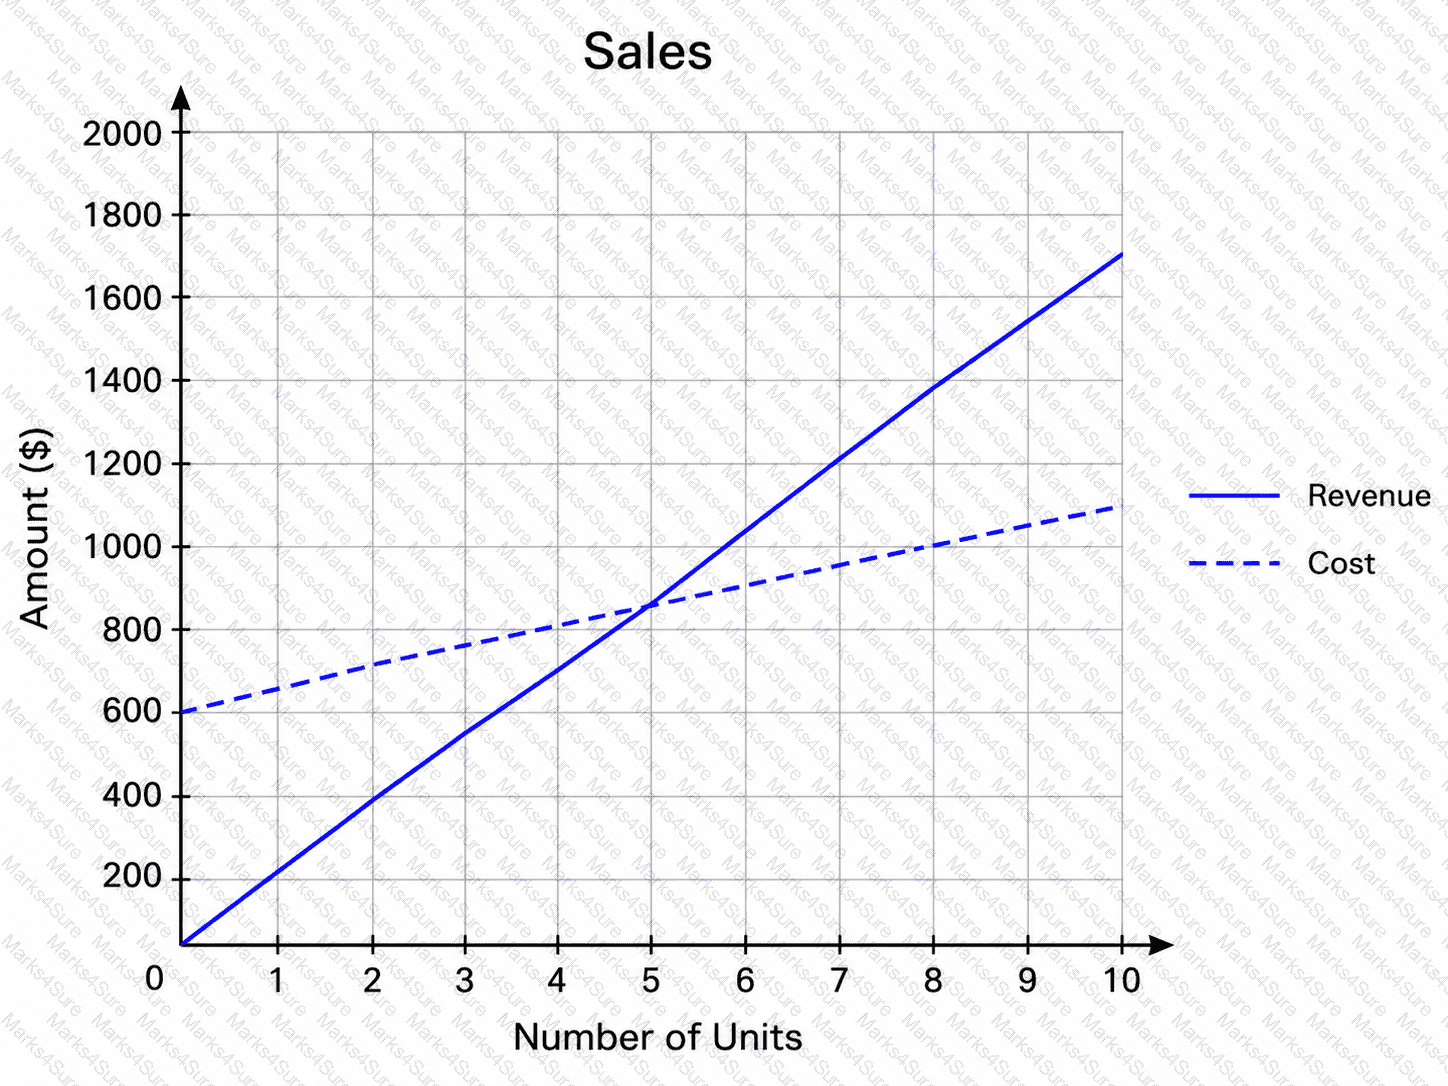
The graph shows the functions that model the cost and revenue.
How many down quilts need to sell to break even/start making a profit?
The number of employees under supervisor B is 13 more than the number of employees under supervisor A. Let F(n)represent the number of employees under the two supervisors, where nis the number of employees under supervisor A and Fis the number of employees under supervisor B.
Which is the correct function to represent this relationship?
After a water tank starts leaking, the amount of water in the tank is modeled by the exponential function that is graphed.
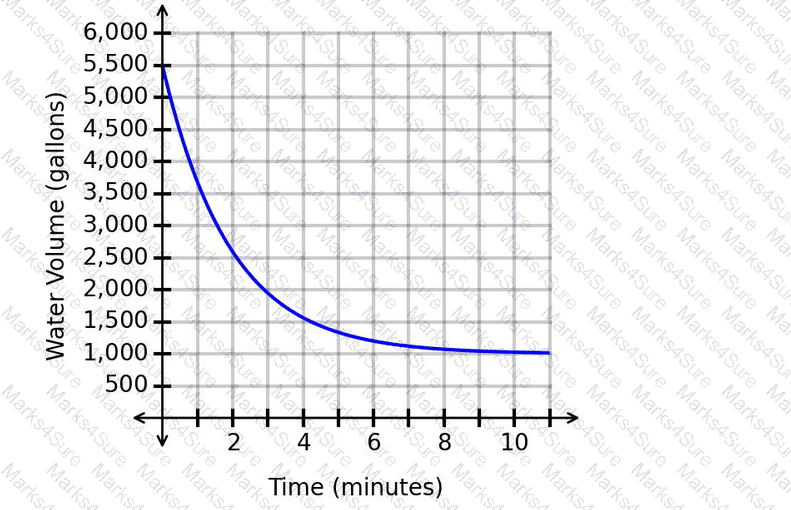
Which statement is justified considering the location of the horizontal asymptote?
Consider the function I(m)=41m²−490m+30, which represents the daily income, I, in dollars, of a store based on the number of months, m, since the beginning of the year. What is the difference between I(7) and I(9)?
The values, in dollars, of two accounts over time are modeled by
A_1 (t)=6,500× 〖 1.05 〗 ^t
and
A_2 (t)=3,000× 〖 0.96 〗 ^t
The variable tis measured in years.
What is the difference between the accounts after 3 years?
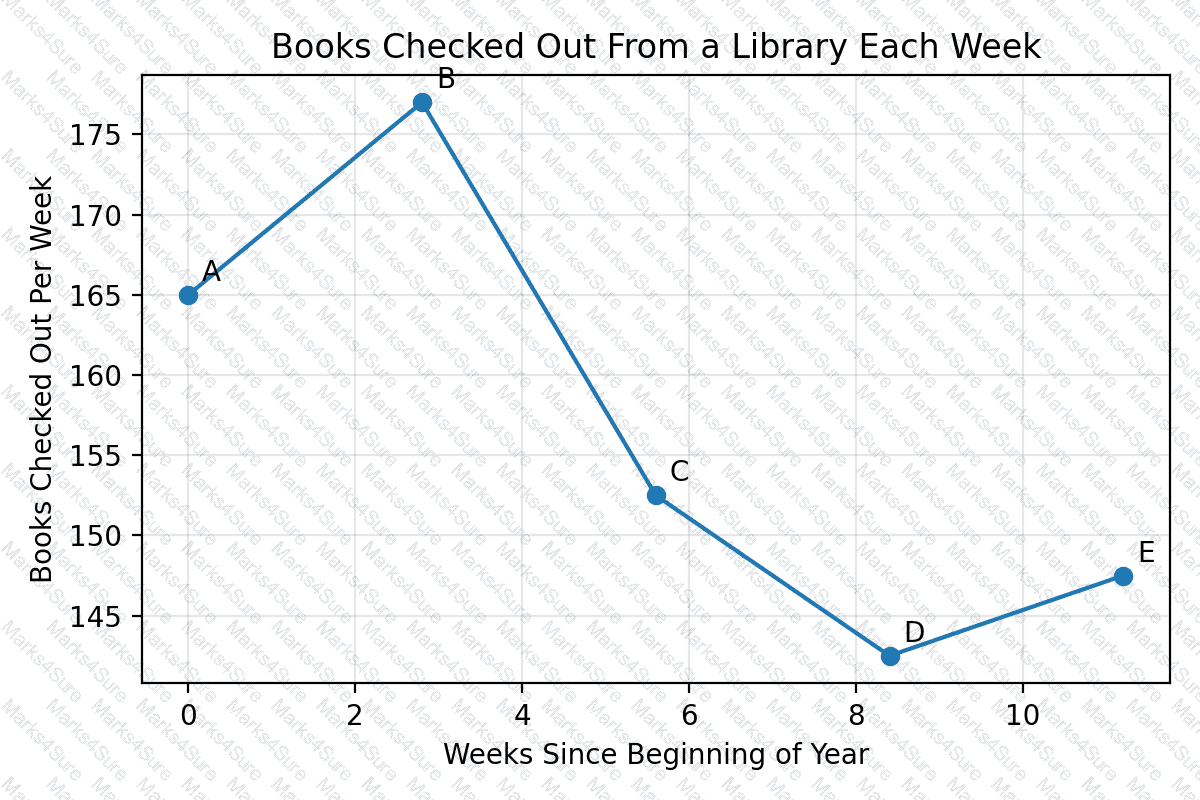
The graph shows the number of books, N, checked out from a library each week. The number of weeks since the beginning of the year is on the horizontal axis, and the number of books checked out per week is on the vertical axis. Point A represents 165 books checked out in the first week, or N(0)=165. Which statement represents an accurate conclusion?
Exhibit:
The number of letters processed daily at a mail center is modeled by the decreasing exponential function shown in the graph.
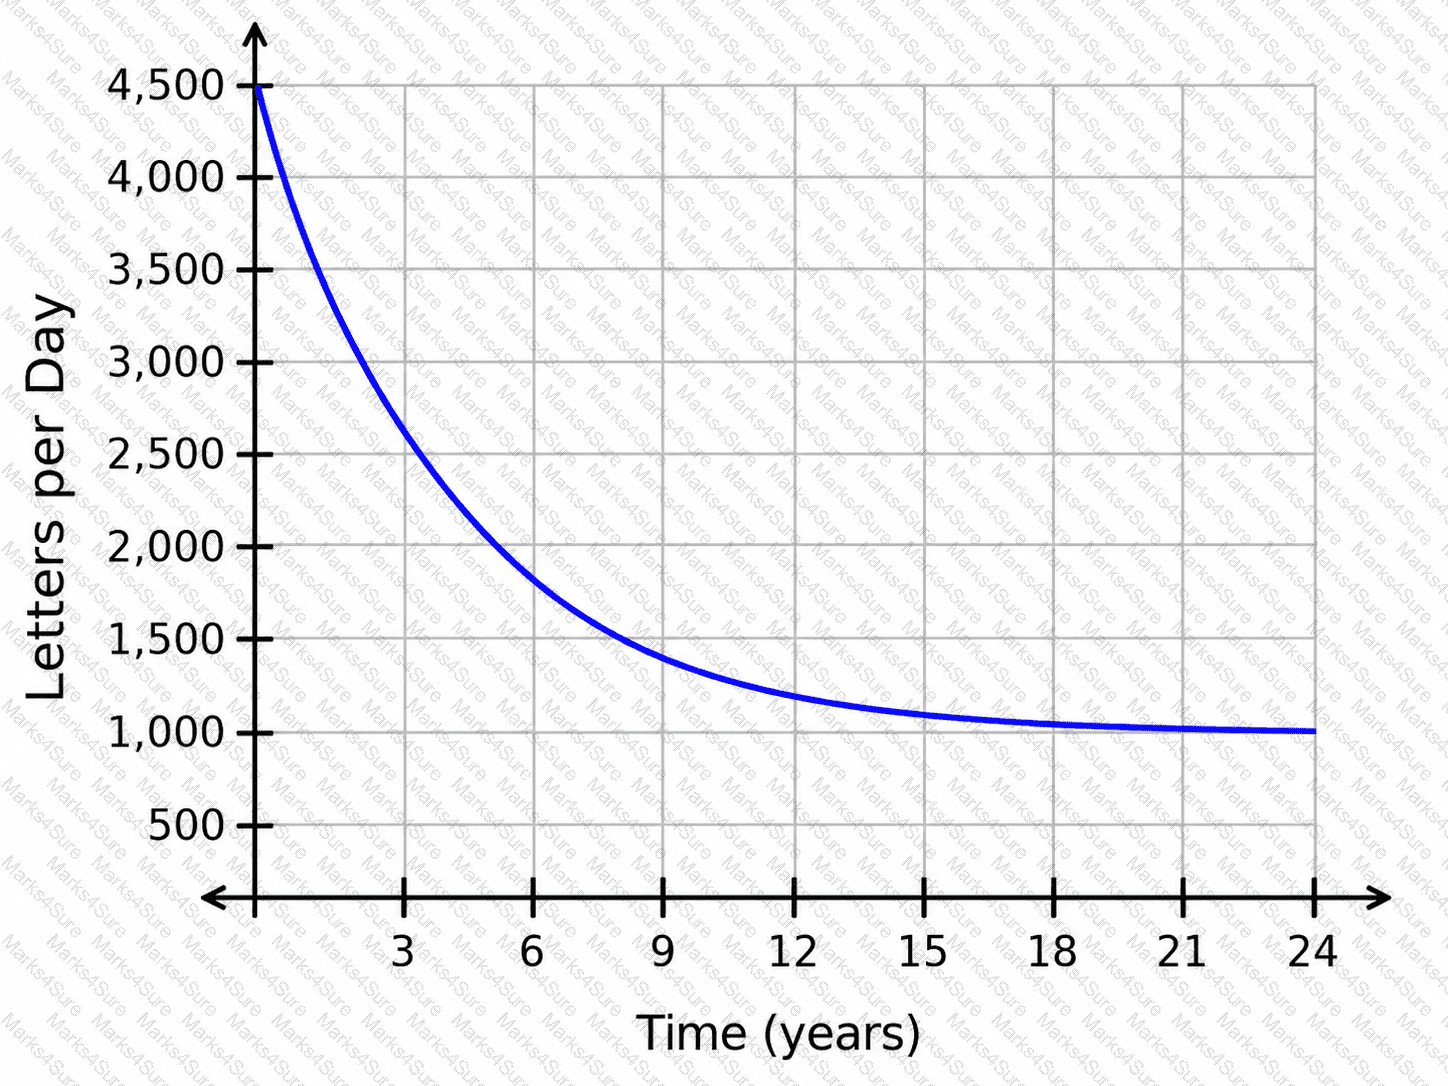
What is the long-term trend in the number of letters processed per day, based on the equation of the horizontal asymptote?
The weight of a radioactive sample is given by the function
W(x)=740× 〖 0.87 〗 ^x
where xis the time, in years, and Wis the weight of the sample, in ounces.
What is the weight of the sample when x=3?
The function
c(t)=-0.01t^4+0.25t^3-2.33t^2+9.02t+8
represents the number of active shopping carts, c, on a website thours after 8:00 a.m.
What is the difference between c(6)and c(8)?
The growth of an animal population is shown in the graph. The instantaneous rate of change at point Pis 3.74.
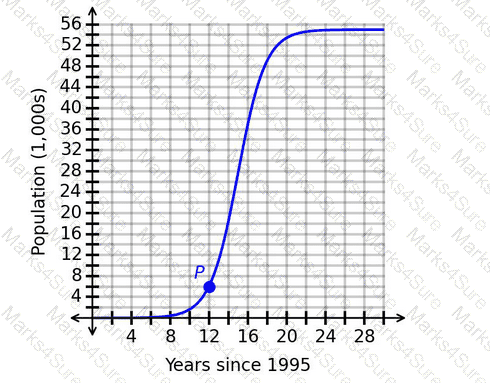
Which interpretation of the instantaneous rate of change is correct?
The given function represents the price of a commodity, p, in dollars, based on the number of months, m, since the beginning of 2020.
p(m)=5m+5
What is the average rate of change of the price over the interval m=1to m=10?
The figure shows the graph of p(t), which represents the number of people, p, at a gym thours after 7:00 a.m.
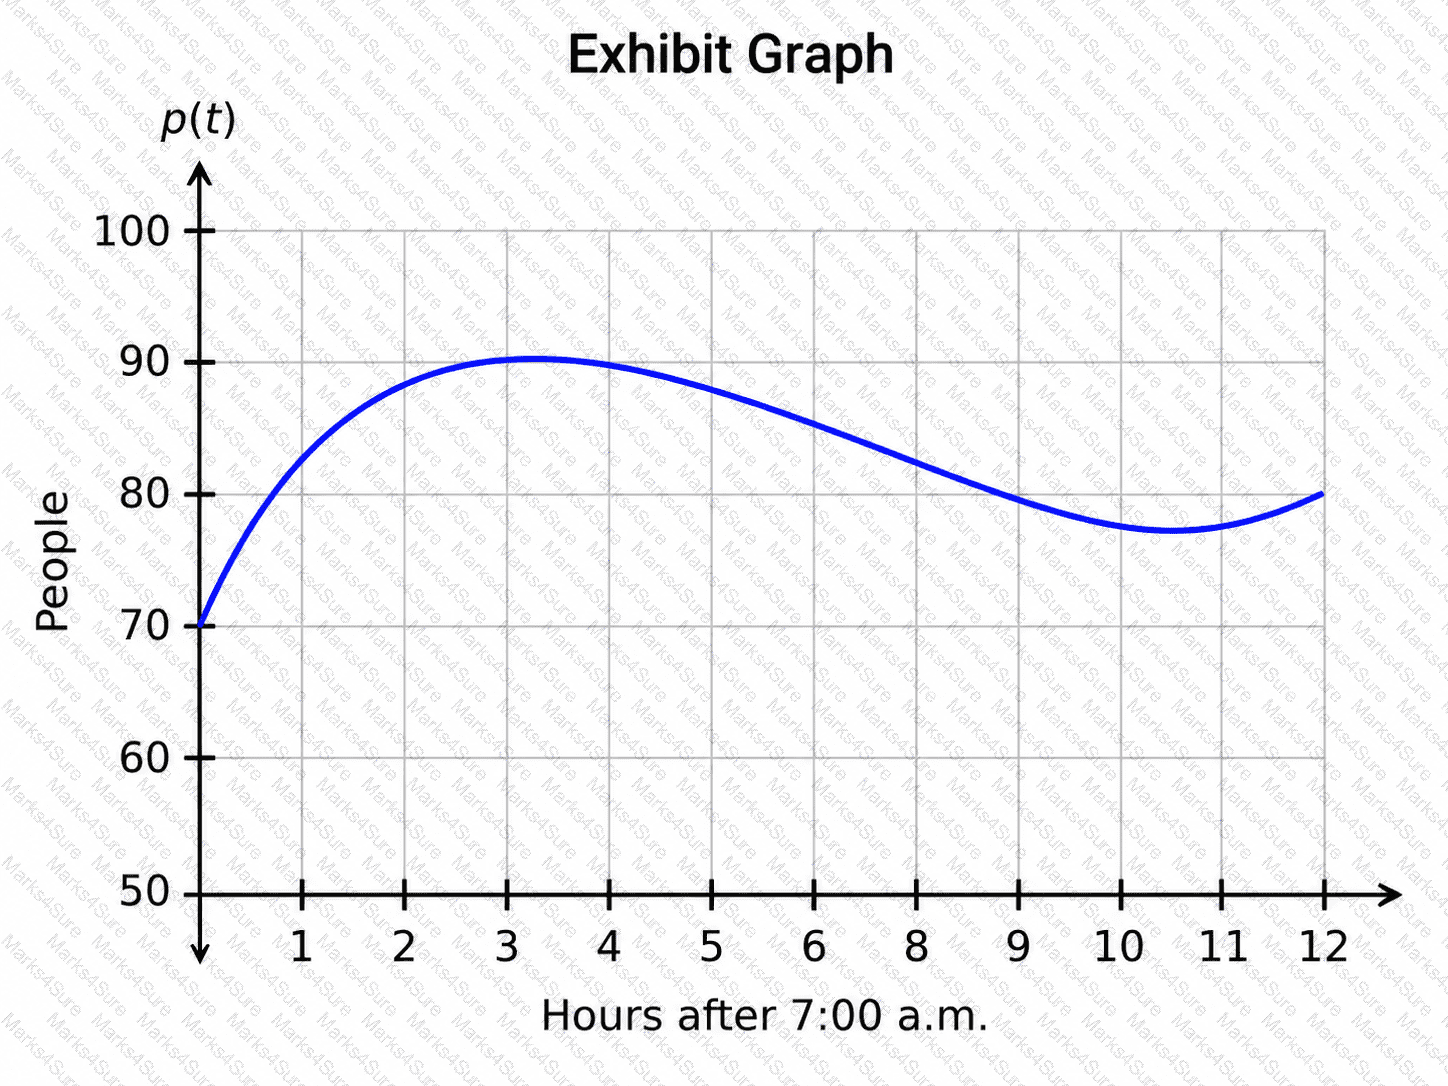
How should the concavity between t=1.3and t=3.4be interpreted?
Based on collected data, the number of employees at a firm can be modeled using the function
f(x)=10× 〖 1.09 〗 ^x
whose graph is shown, where xrepresents the number of years since 2001 and f(x)represents the number of employees, in thousands.
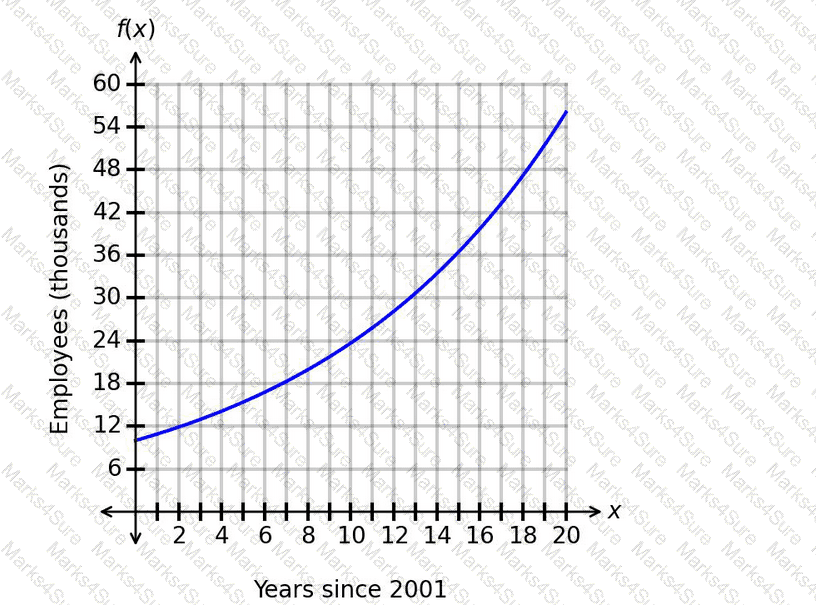
Which time period has the fastest average increase in the number of employees?
The populations, in thousands, of two towns are shown in the graph, where the horizontal axis measures the time in years.
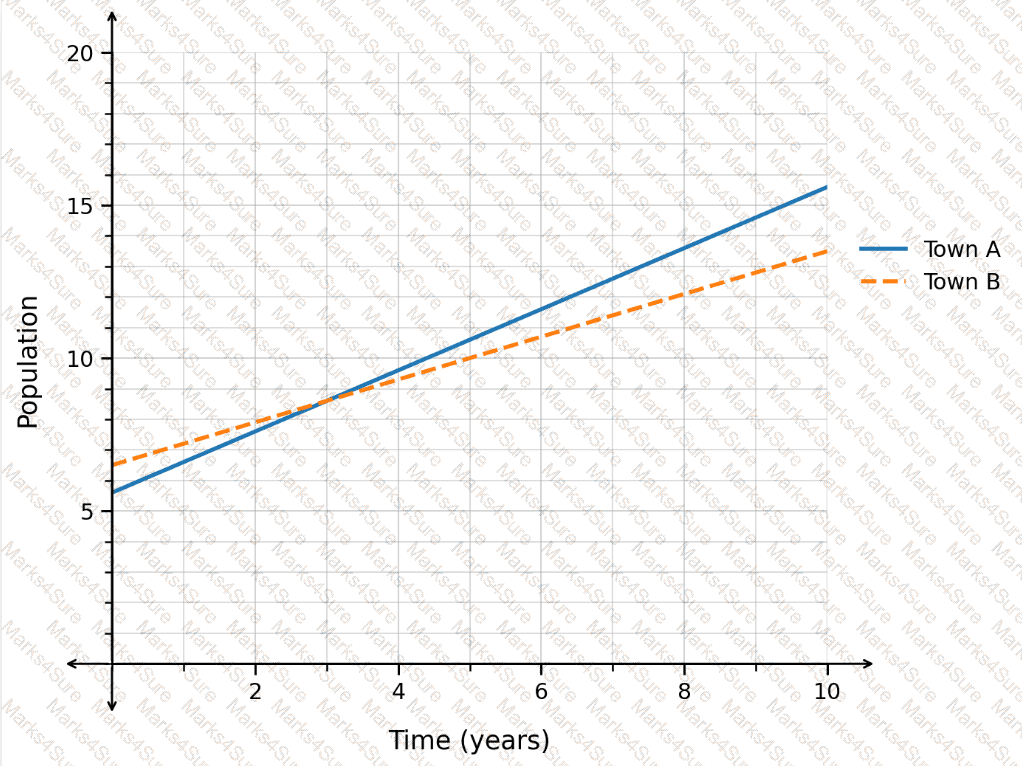
Which town’s population is growing at a faster rate?
The number of people auditioning for a game show is expected to be 3 less than the number of people who auditioned last year. The function A(t)can be used to model the situation, where trepresents the number of people who auditioned last year and Arepresents the number of people expected to audition this year.
Which quantity represents the number of people expected to audition this year, given that 280 people auditioned last year?
PDF + Testing Engine

Testing Engine
PDF (Q&A)