
Free Practice Questions for the WGU Courses and Certificates Applied-Probability-and-Statistics Exam (2026 Updated)
At Marks4sure, we are dedicated to providing IT professionals with the most accurate and reliable preparation materials for the WGU Applied-Probability-and-Statistics exam. To support your certification journey, we have made a selection of our premium 2026 Courses and Certificates practice questions and answers available completely free. You can take this practice test as many times as you need. Every question includes a detailed, expertly verified explanation to ensure you fully grasp the core security concepts before test day.
A team of scientists wants to understand the relationship between smoking and lung cancer. They collect data from 1,000 individuals, recording their smoking habits and whether they have been diagnosed with lung cancer. The scientists then analyze the data to find any correlations.
Is this study observational or experimental?
The average commute time for workers in a city in 2021 was 35 minutes, with a standard deviation of 5 minutes.
Assuming a normal distribution, which two values encompass 95% of the data?
A standard deck of 52 playing cards, 13 with hearts, 13 with diamonds, 13 with clovers, and 13 with spades, is shuffled, and one card is drawn at random.
What is the probability of drawing a heart?
In a class of 40 students, the following data were collected on their favorite sport:
Soccer: 10 students
Basketball: 15 students
Tennis: 5 students
Swimming: 10 students
What is the relative frequency of students whose favorite sport is not basketball?
A commuter has a .4 probability of taking the bus to work, a .4 probability of driving a car, and a .2 probability of cycling. The probability of being late is .15 when taking the bus, .05 when driving a car, and .1 when cycling.
What is the probability of taking the bus and being on time, or driving a car and being on time?
A researcher has collected information on students from a school. The researcher wants to display the ethnic groups represented in the school.
Which pair of graphs both display data in this manner?
Review the following inequality:
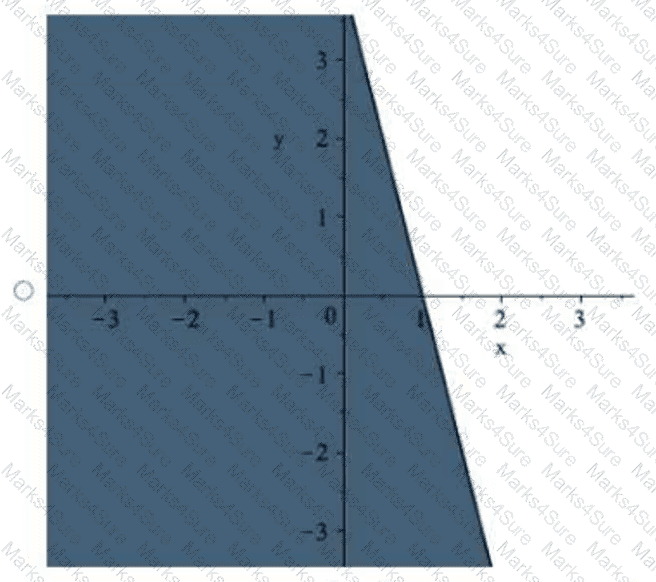
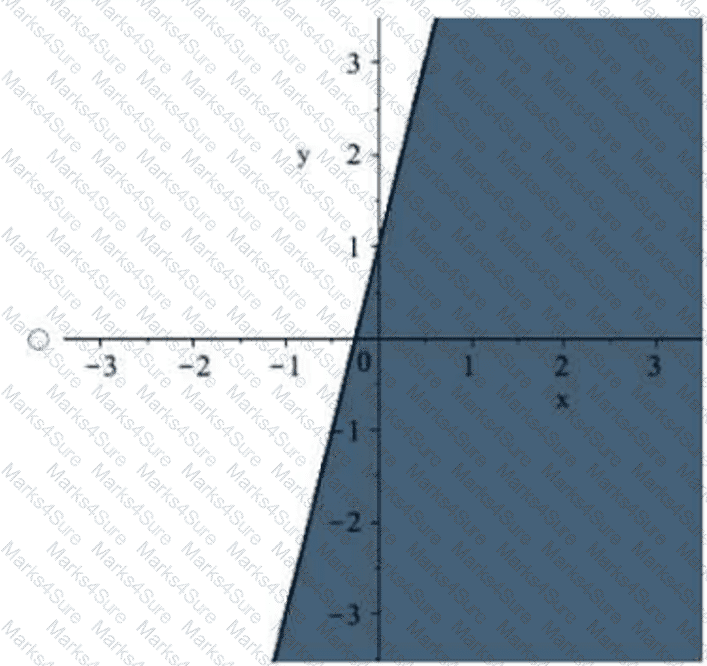
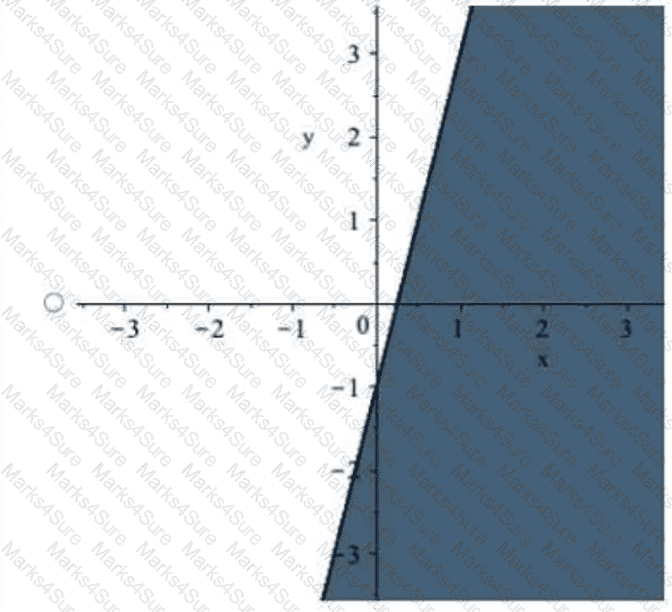
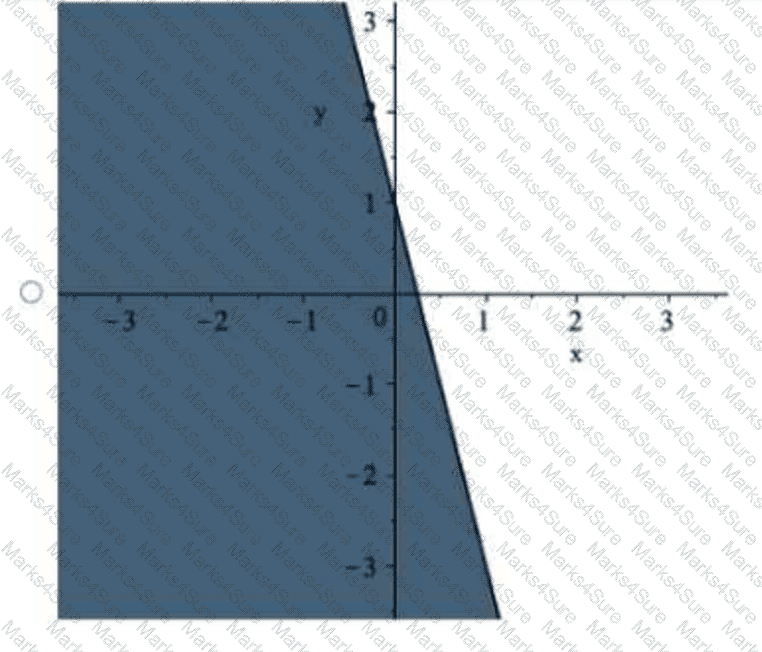
y ≤ −4x + 1
Which shaded region is described by this inequality?
A home inspector finds 3% of the homes in a community infected with termites.
How should the home inspector’s findings be interpreted?
The pie chart shows the contribution of different renewable energy sources to the total energy production.
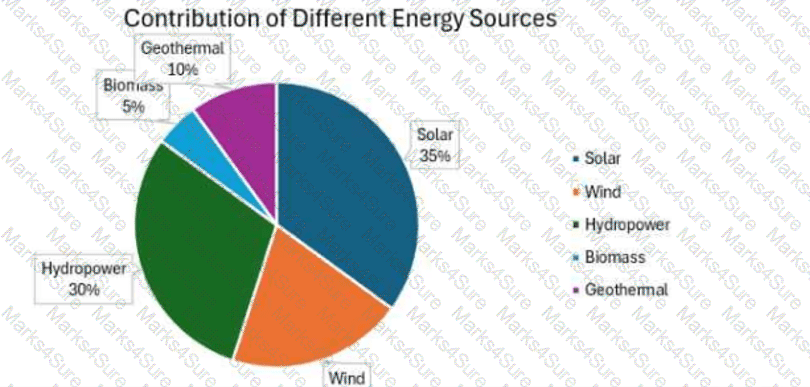
What is true about the given data?
A child’s parents want to analyze the relationship between the daily high temperature and ice cream sales at their child’s ice cream stand. They create the following scatterplot.
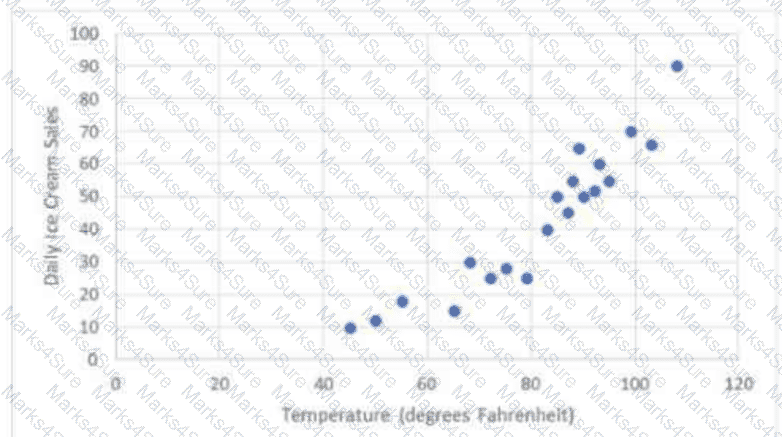
What is the estimated value of r, the correlation coefficient, between these variables?
A single ball is drawn from an opaque bag that contains red, blue, and green balls. The probability of drawing a red ball is .3, and the probability of drawing a blue ball is .6.
What is the probability of drawing a green ball?
A café recorded the total ice cream sales and the average maximum temperature of the day. The scatterplot shows the recorded data. The regression equation y = 13x − 598 estimates the total ice cream sales, y, of a day and the average maximum temperature, x, on that day.
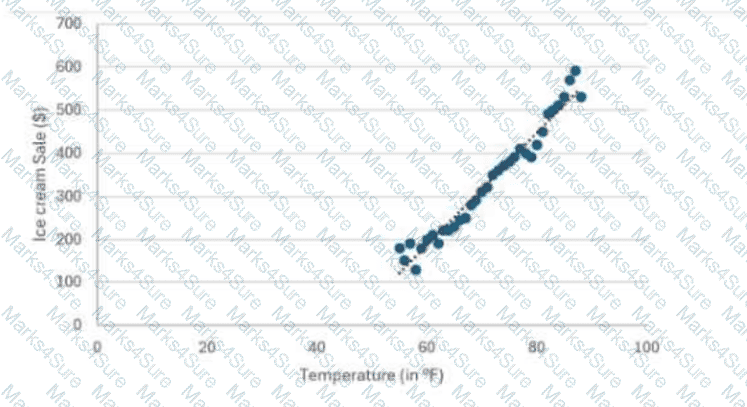
What does the slope represent in this context?
PDF + Testing Engine

Testing Engine
PDF (Q&A)