Free Practice Questions for the Salesforce Consultant CRM-Analytics-and-Einstein-Discovery-Consultant Exam (2026 Updated)
At Marks4sure, we are dedicated to providing IT professionals with the most accurate and reliable preparation materials for the Salesforce CRM-Analytics-and-Einstein-Discovery-Consultant exam. To support your certification journey, we have made a selection of our premium 2026 Salesforce Consultant practice questions and answers available completely free. You can take this practice test as many times as you need. Every question includes a detailed, expertly verified explanation to ensure you fully grasp the core security concepts before test day.
A consultant creates a CRM Analytics dashboard in a sandbox and it needs to be migrated into production.
What should the consultant use to complete the migration?
Universal Containers ' CRM Analytics team is building a dashboard with two widgets, and the queries use different datasets.
1. List widget associated to the query " Type_2 " and grouped by the dimension " Type " (multi-selection)
2. Donut chart widget associated to the query " Query_pie_3 " and grouped by the dimension " Type "
The team wants any selection in the List widget to filter the Donut chart and vice versa. Users should be able to choose more than one Type (multi-selection).
What is the recommended way to accomplish the required filtering?
A consultant wants to understand what the important predictors are in a model.
Where is this information found?
The marketing team at Cloud Kicks has five dashboards in an app. Four widgets are replicas of each other in three of the dashboards.
What is the best way to maintain these widgets?
A team of CRM Analytics developers has been working on an existing recipe to add new derived fields. The edited version has been failing ever since, and management is requesting that the dashboard show refreshed data while they work on the edits.
How can the developers add new fields while keeping the dataset refreshed?
The CRM Analytics consultant at Universal Containers has set data syncs and recipe runs back to back. However, they notice that the data syncs and recipe run jobs fail repeatedly. Upon investigation,
they realize the data syncs and recipes are tightly coupled which leads to too many runs being queued and eventually being canceled.
How should the consultant resolve this issue?
Universal Containers builds a new sales dashboard and wants to makesure account managers can access the dashboard while traveling.
What should the consultant consider doing in this process?
Universal Containers (UC) is rolling out CRM Analytics to its field sales that include dashboards withorder data from an external source.
UC has a well-defined role hierarchy where everyone is assigned to an appropriate node on the hierarchy. In addition, the order data has a reference to a Salesforce opportunity.
An individual sales rep should be able to view all orders that they own or as part of the account team or opportunity team. The sales manager should be able to view all orders for the entire sales team. Similarly, the VP of sales should be able to view orders for everyone who rolls up in that hierarchy.
The dataset has a field called Ownerld which represents the order owner.
Given this information, how should a CRM Analytics consultant implement the above requirements?
Universal Containers wants to create two dashboards and has two user groups. The ' Regional Performance’ dashboard should be accessible to sales reps and managers/executives to keep track of
how sales reps are performing in each region. Sales reps must only be able to see data pertaining to their respective region. The ‘National Performance’ dashboard is using the same data as the other
dashboard but should only be accessible to managers/executives to compare data across all regions.
In addition to row-level security to view only regional data, how should a consultant ensure that sales reps are unable to view the ‘National Performance’ dashboard?
A model created with a GLM algorithm produced unsatisfactory results.
When re-running the model, which type of algorithm should the consultant use to improve the results?
The CRM Analytics consultant at Universal Containers notices that some users have access to sensitive data and dashboards they should not have access to in the Manager ' s app.
How should the consultant fix the problem?
At Universal Containers, a dashboard is built to track sales metrics. The Opportunity amount field has conditional formatting added — it turns green for closed won and red for closed lost.
How should a CRM Analytics consultant enhance the dashboard design to become more accessible to users with color vision challenges?
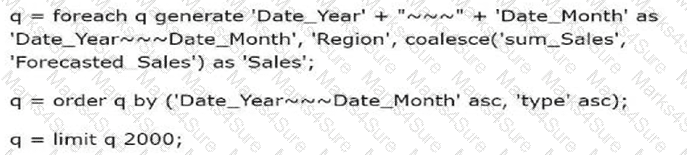
Universal Containers (UC) creates a dataset, " Book11 " , containing a budget per region per month for the first 6 months of the year, as shown in the graphic below. Now, UC wants to create a lens showing
the total budget for each region for each month. Every combination of region and month must be shown in the lens, even if there is no data.
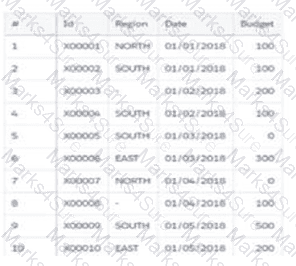
How should a CRM Analytics consultant help UC build this lens?
Cloud Kicks (CK) wants to use CRM Analytics to analyze trends of its sales pipeline in order to accelerate the company ' s sales process. To do so, CK needs to know the average time an opportunity
spends in each stage. The data can be found in the Opportunity History object, but the value is not pre-calculated in Salesforce, so a consultant recommends using a recipe to calculate it.
How should the consultant use a recipe to calculate the average time an opportunity spends in each stage?
A CRM Analytics consultant at Cloud Kicks wants to create a new dashboard that uses custom GeoJSON to display data; however, they are unable to upload the file via the user interface (UI).
Which action should the consultant take?
A client has two datasets that are used across seven different dashboards. Three of these dashboards are used by marketing and four are used by sales. The client requires that only marketing can
access the marketing dashboards and only sales can access the sales dashboards.
Which solution should a consultant recommend?
A CRM Analytics administrator is working on deploying a dashboard and a dataset from a developer sandbox to a full sandbox. They have deployed the dataset via change set and manually copy-pasted the dashboard JSON into the target org. However, they notice that the conditional formatting and the widget-specific number formats have been lost in the target environment.
What is causing this issue?
A CRM Analytics consultant has been asked to bring data from an external database as well as five external Salesforce environments into CRMAnalytics. Twenty-five objects have been enabled from the local Salesforce connector.
The requirements are:
* 10 objects should be enabled from an external database
* 12 objects each from three of the external Salesforce environments
* 15 objects each from the remaining two external Salesforce environments
The consultant estimates each connector will, per object, bring between 1,000 and 1 million rows of data.
Which limit will be exceeded?
Several users are complaining they are unable to see a specific dashboard on a Salesforce Lightning page anymore. The CRM Analytics consultant logs in as one of the users and sees an error
page once the dashboard is opened.
How should the consultant solve this issue?
CRM Analytics team plans to enable data sync.
Which limit specific to data syne should the team consider before enabling the feature because it may impact existing jobs?
A system administrator and a CRM Analytics consultant are working together on deploying arecipe/dataflow and a dataset to another org. Prior to this deployment, a package was deployed with all the custom fields used in the dataflow and dataset.
While running the recipe/dataflow in the target environment, the consultant encounters multiple errors related to these custom fields.
How should this be resolved?
Cloud Kicks has informed CRM Analytics developers that they have two scenarios with restricted row-level security.
The parameters being:
1. Non-CXOs and VPs working in EMEA can have access to EMEA records only.
2. CXOs and VPs should have access to all data irrespective of the region (APAC, EMEA, etc.).
Which sharing method works for this scenario?
Exhibit.
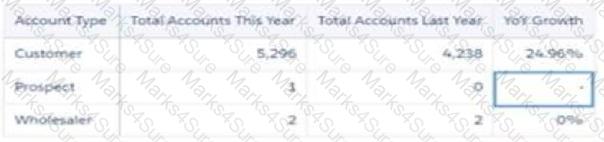
Universal Containers has a dashboard for sales managers to visualize the Year Over Year (YoY) growth of their customers. The formula used is:
YoY = [(This Year — Last Year) / Last Year] %
Based on the graphic, when there is not an account in the Last Year column, the YoY Growth shows null results. The sales managers want to replace it with 100% value.
What is the correct function to use?
A CRM Analytics consultant is asked to make changes to the current sales dashboard at Cloud Kicks. The dashboard is crucial to track the daily sales performance of the company and needs to be
available for other users while the consultant works on the changes.
How should the consultant proceed to update the dashboard?
A CRM Analytics consultant has been asked to refactor a dashboard so that it loads quicker. After some analysis, the consultant found that most of the dashboard queries run in less than 5 seconds; however, the Opportunities Table takes more time to load when scrolled down from its initial view.
How should the consultant improve the performance of this dashboard?
The sole manager of a CRM Analytics app at Cloud Kicks is leaving the company.
What should the CRM Analytics consultant do to ensure the app remains accessible?
ACRM Analytics consultant is reviewing results from an Einstein Discovery story with a business user. They agree with the findings but notice that none of the fields used in the story have a correlation value greater than 4%. The client is now concerned that the model
may not be good enough to deploy.
Which action should the consultant take?
CRM Analytics consultant receives a new project from a client that wants to implement CRM Analytics. They do not currently have CRM Analytics but want guidance on how to ensure their users have the correct access.
They have 1,000 users with a small team of three people who will build both datasets and dashboards. An additional 15 people should be able to only create dashboards. The remaining users should only be able to view dashboards.
Which recommendation should the consultant give the client?
Which recommendation should the consultant give the client?
PDF + Testing Engine

Testing Engine
PDF (Q&A)