Free Practice Questions for the Tableau Desktop Certified Associate Desktop-Certified-Associate Exam (2026 Updated)
At Marks4sure, we are dedicated to providing IT professionals with the most accurate and reliable preparation materials for the Tableau Desktop-Certified-Associate exam. To support your certification journey, we have made a selection of our premium 2026 Tableau Desktop Certified Associate practice questions and answers available completely free. You can take this practice test as many times as you need. Every question includes a detailed, expertly verified explanation to ensure you fully grasp the core security concepts before test day.
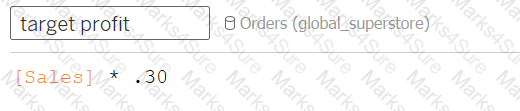
Connect to the "Global Superstore" data source and use the Orders table. Create a bar in bar chart and compare the profit against the target profit for Canada Region. Consider target profit is 30% of the sales. Which of the following sub-categories has met or exceed the target profit?
 Graphical user interface, application
Description automatically generated
Graphical user interface, application
Description automatically generated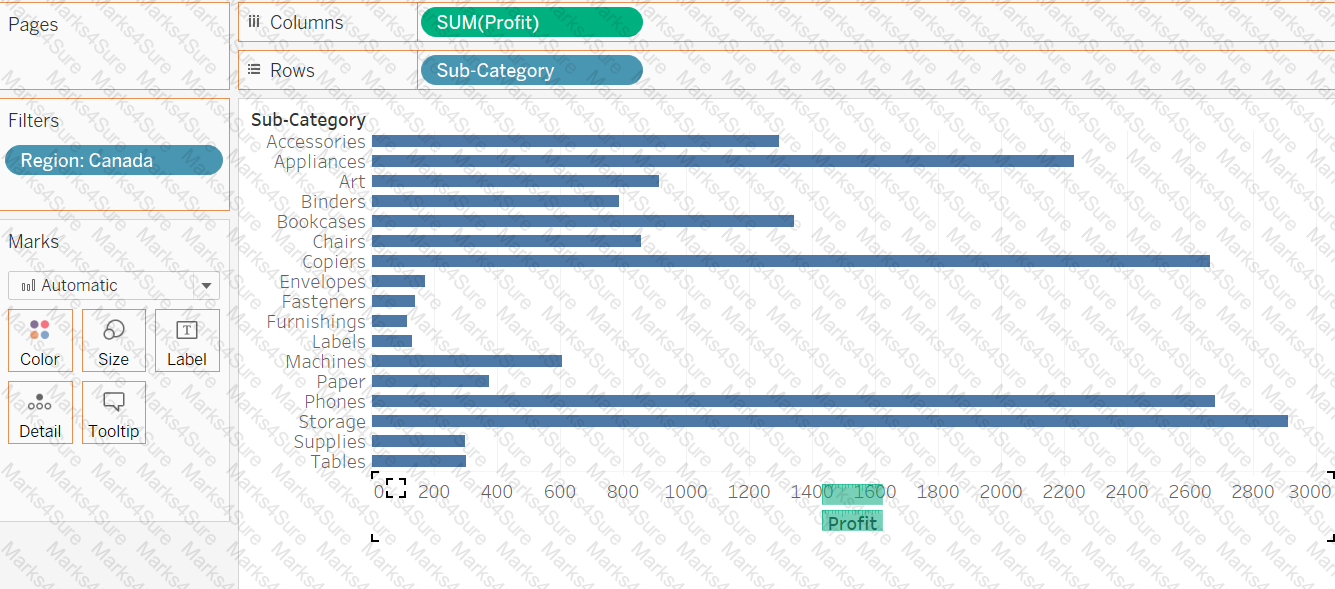 Chart, bar chart
Description automatically generated with medium confidence
Chart, bar chart
Description automatically generated with medium confidence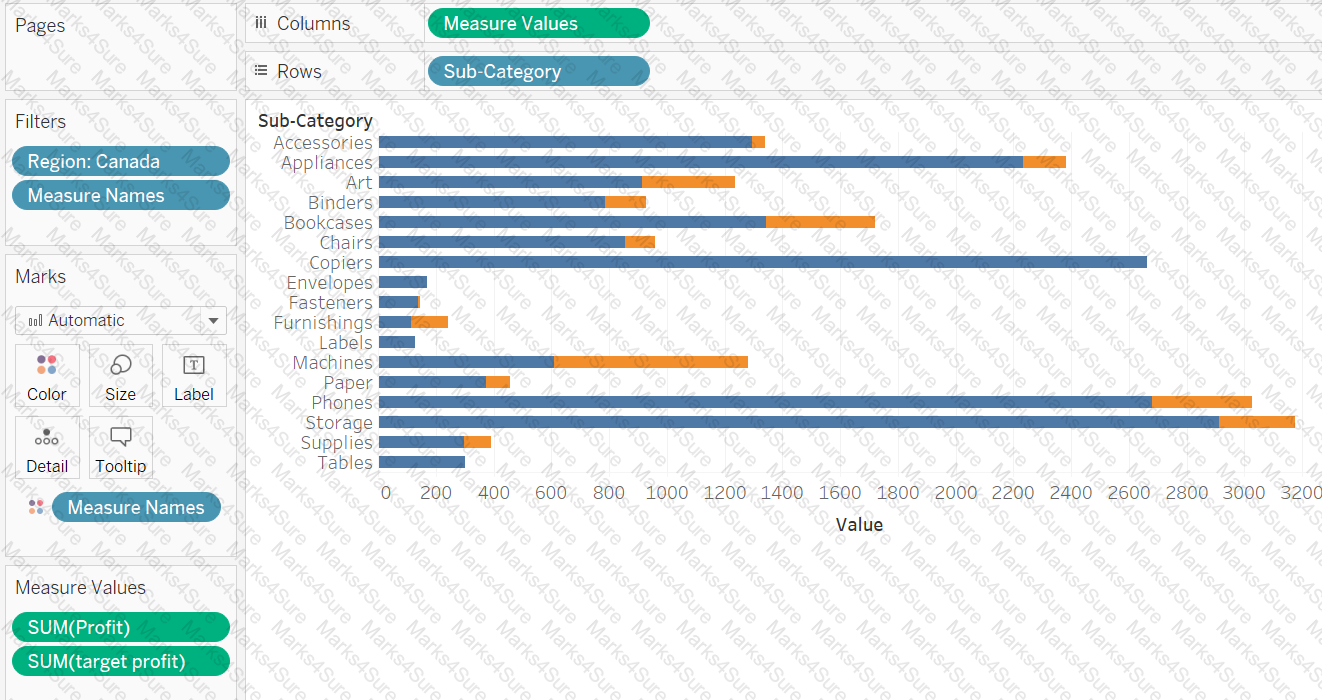 Chart, bar chart
Description automatically generated
Chart, bar chart
Description automatically generated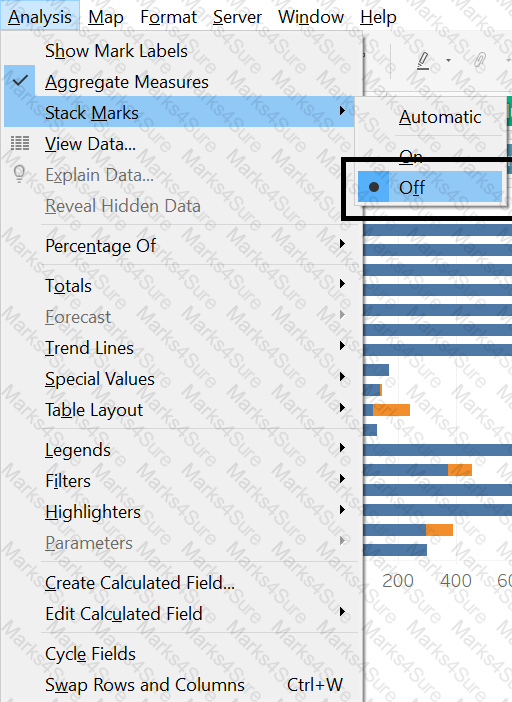 Graphical user interface
Description automatically generated with medium confidence
Graphical user interface
Description automatically generated with medium confidence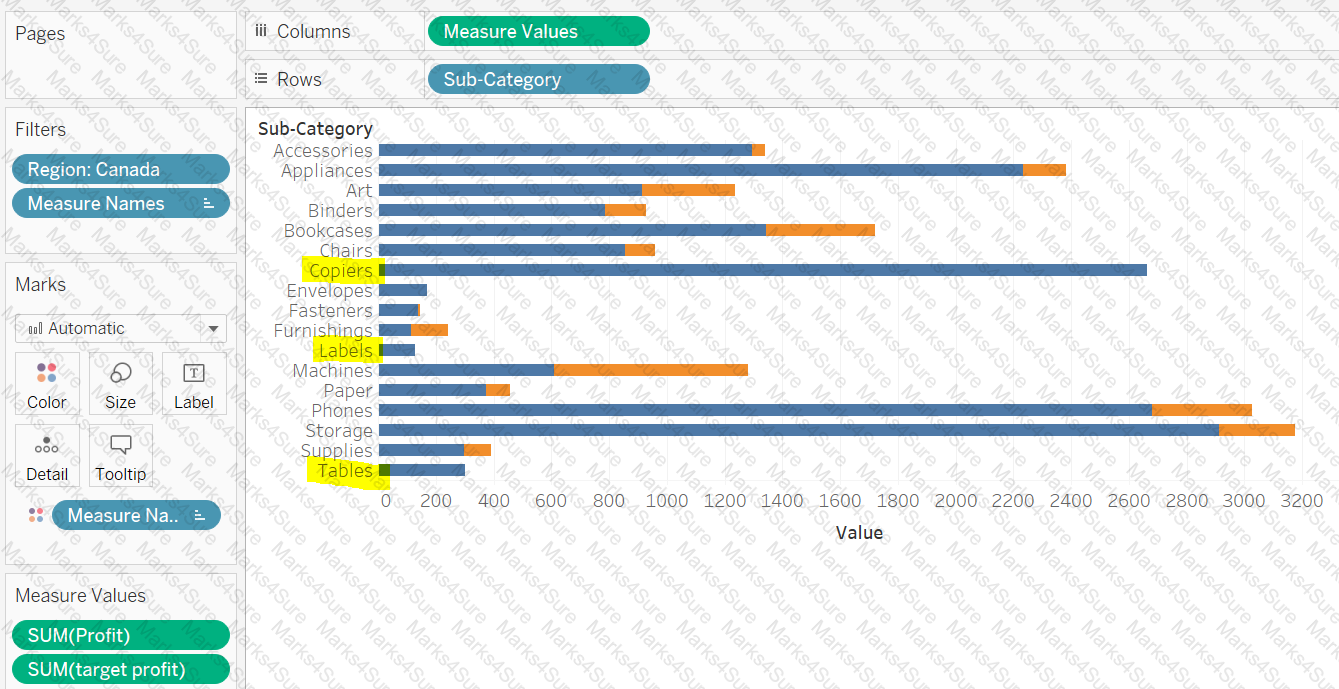 Chart
Description automatically generated
Chart
Description automatically generated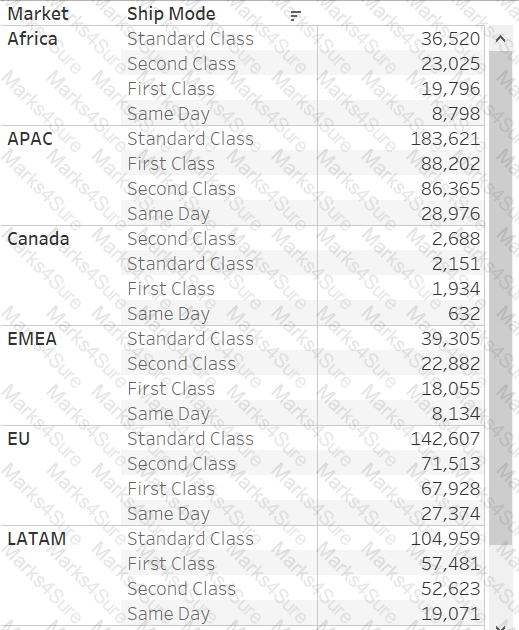
To create this view, what all you have to do from the following options?
Larger image
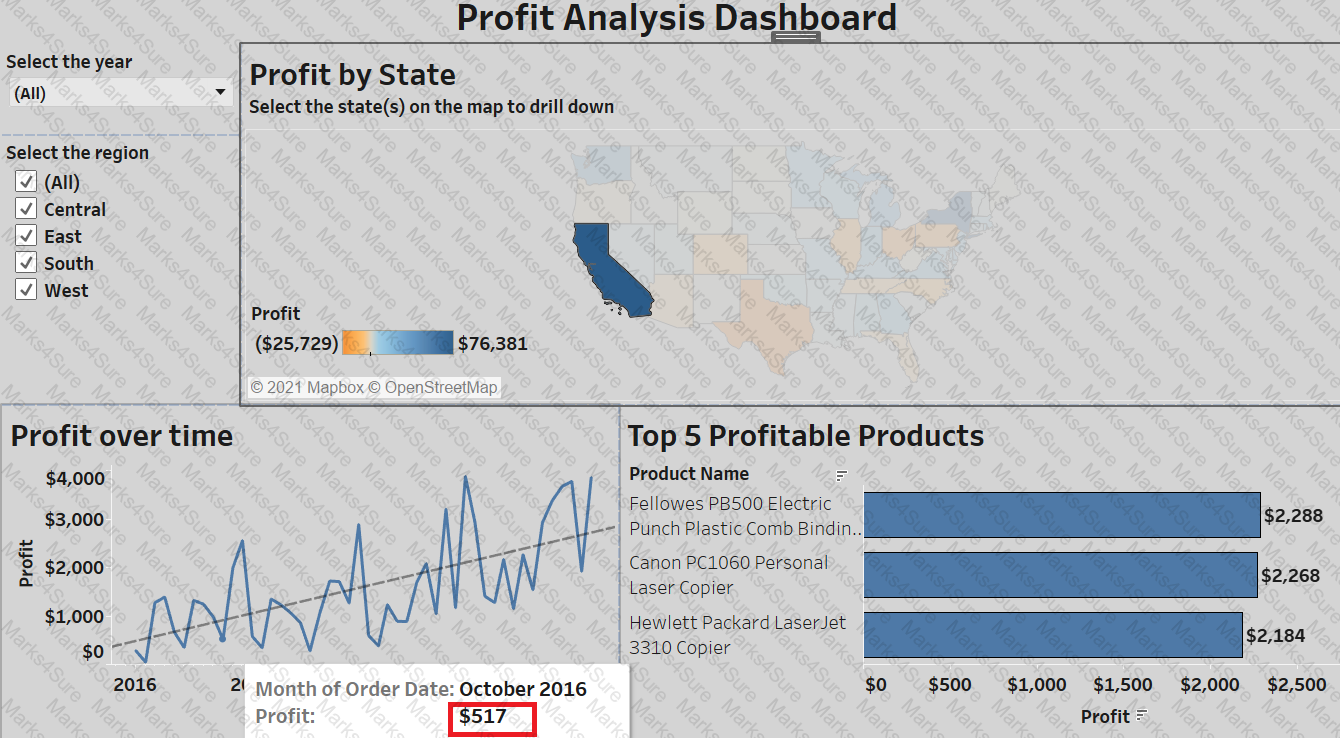
Using the Profit Analysis Dashboard twbx file, find out the profit recorded in October 2016 by California State in the West region? You can add the functionality to the dashboard.
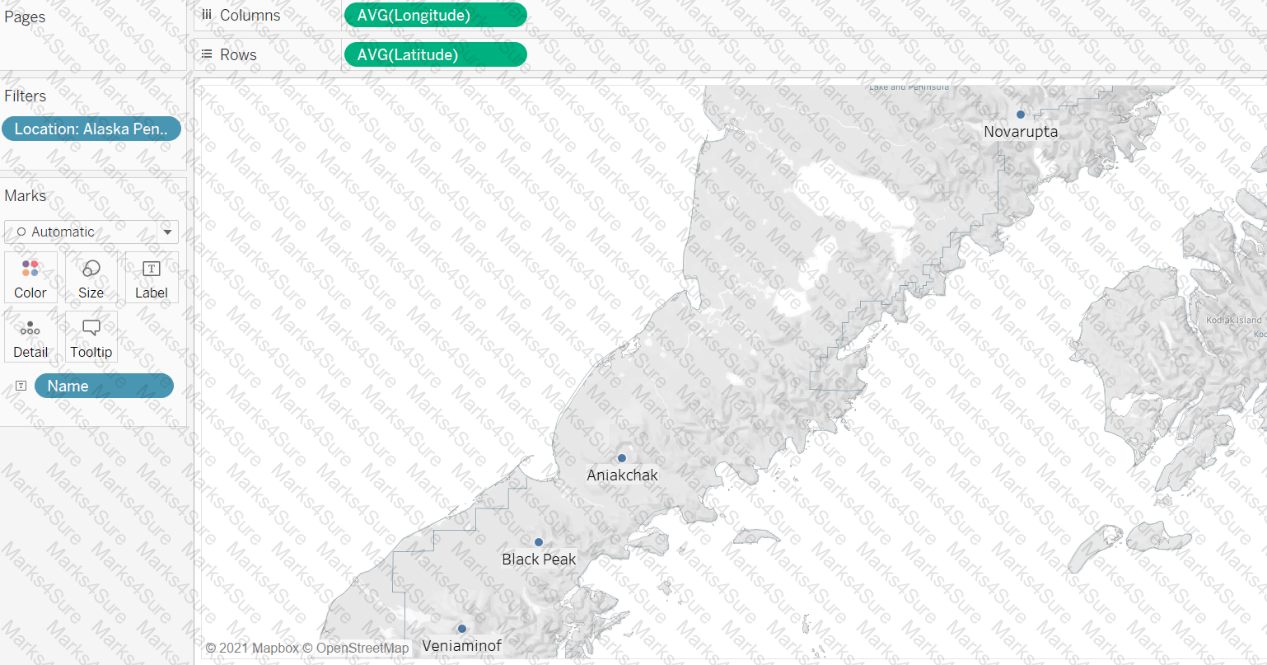
Connect to the "Significant Volcano Eruption" data source. How many volcano eruptions took place within 30 miles of the Black Peak volcano in the Alaska Peninsula?
 Map
Description automatically generated
Map
Description automatically generated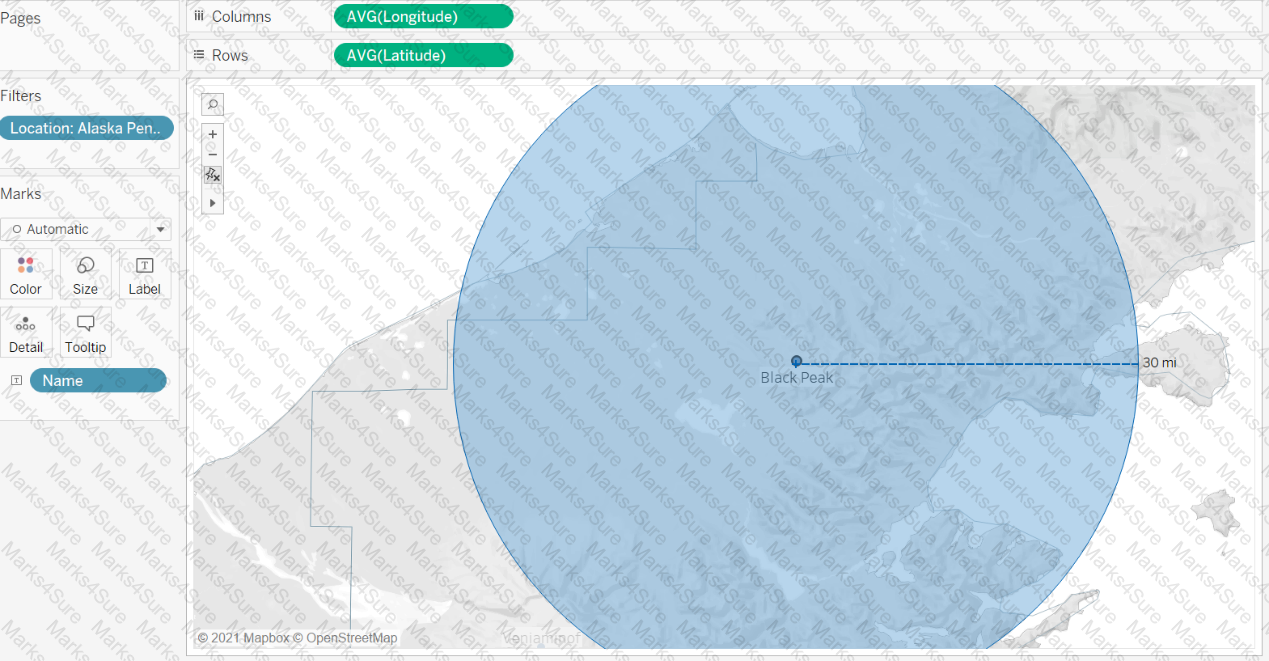 A picture containing chart
Description automatically generated
A picture containing chart
Description automatically generated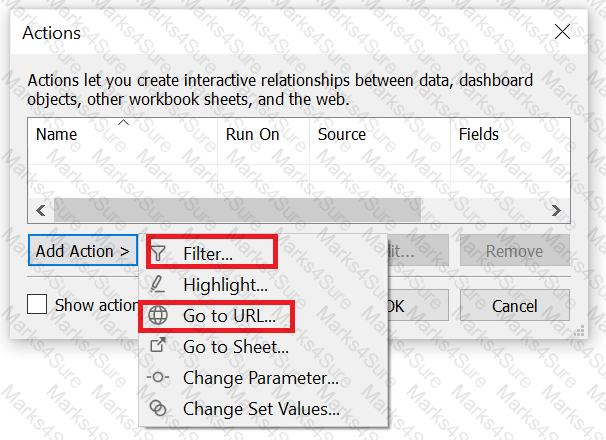 Graphical user interface
Description automatically generated
Graphical user interface
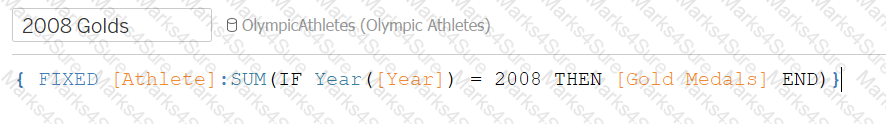
Description automatically generatedConnect to the Olympic Athletes data source, which athlete won at least one gold in 2008 Olympics and then won at least 4 golds in 2012 Olympics.
 Graphical user interface, text, application, website
Description automatically generated
Graphical user interface, text, application, website
Description automatically generated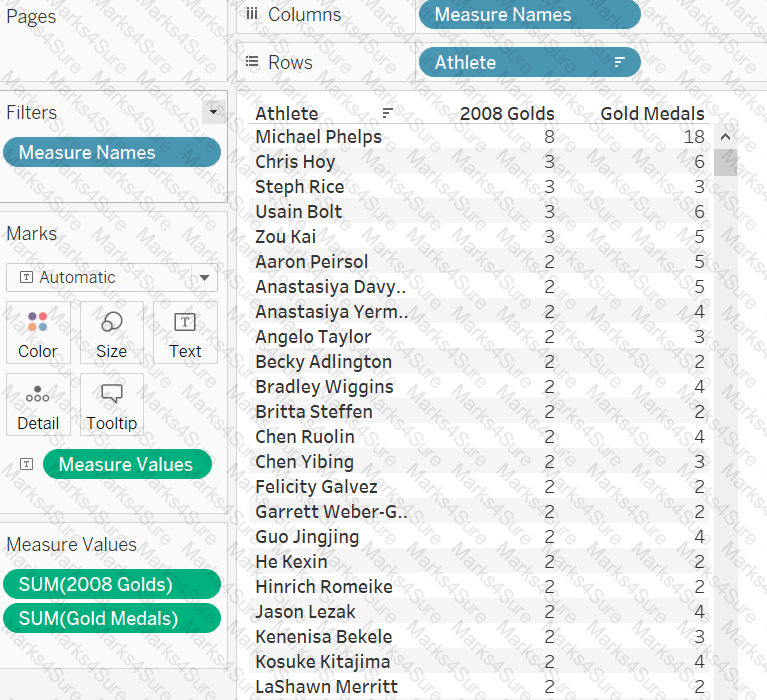 Graphical user interface, text, application
Description automatically generated
Graphical user interface, text, application
Description automatically generated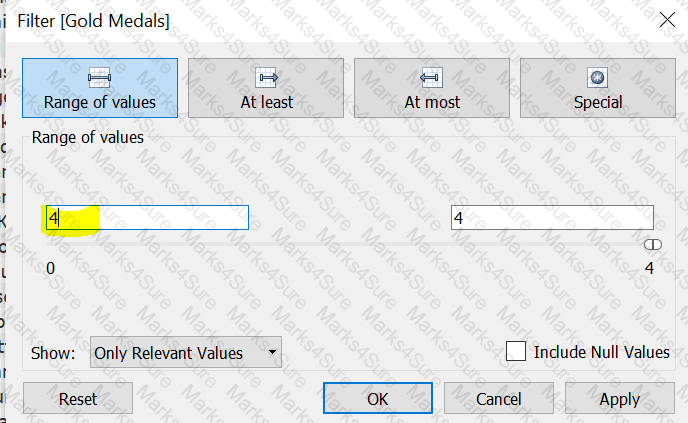 Graphical user interface
Description automatically generated
Graphical user interface
Description automatically generated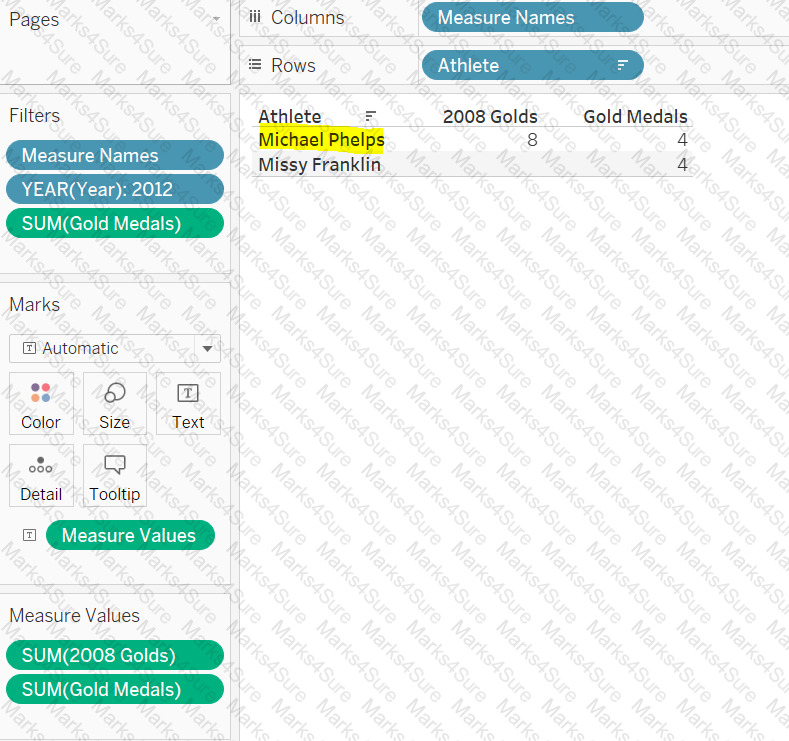 Graphical user interface, text, application, chat or text message
Description automatically generated
Graphical user interface, text, application, chat or text message
Description automatically generatedConnect to the "Significant Volcano Eruption" data source. In 1899, the Dona Juana volcano erupted in Colombia. Find out which volcano in the Popayán city is the closest to Dona Juana and how many death Dona Juana volcano caused?
 Graphical user interface, text, application
Description automatically generated
Graphical user interface, text, application
Description automatically generated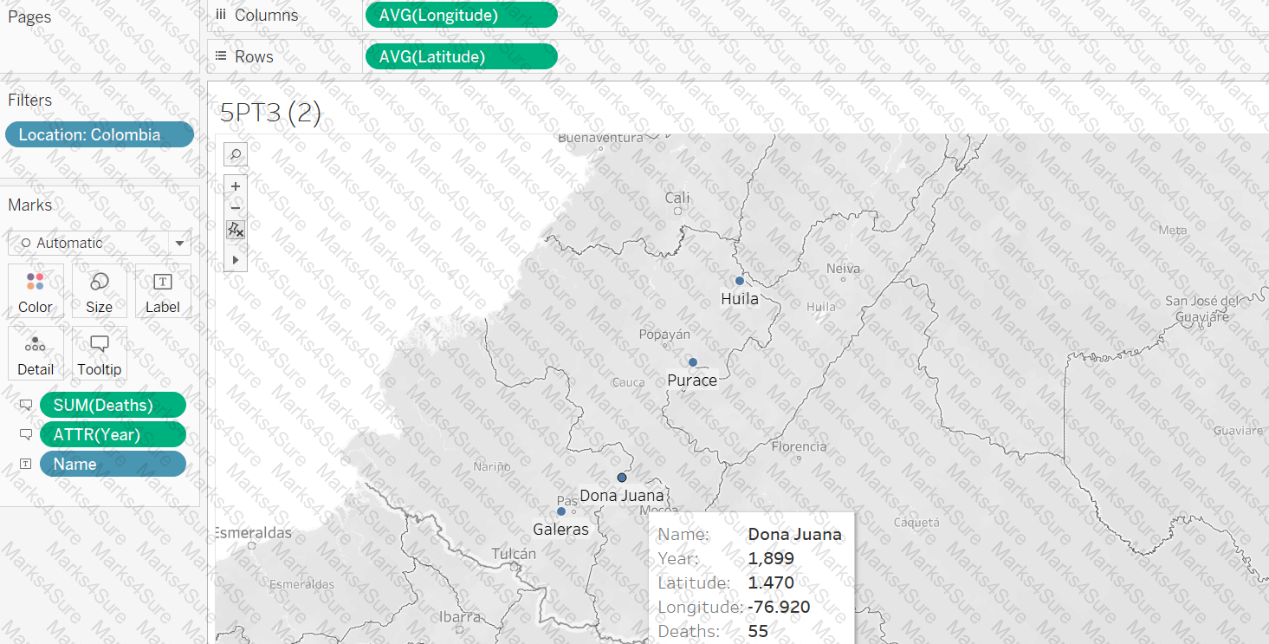 Map
Description automatically generated
Map
Description automatically generated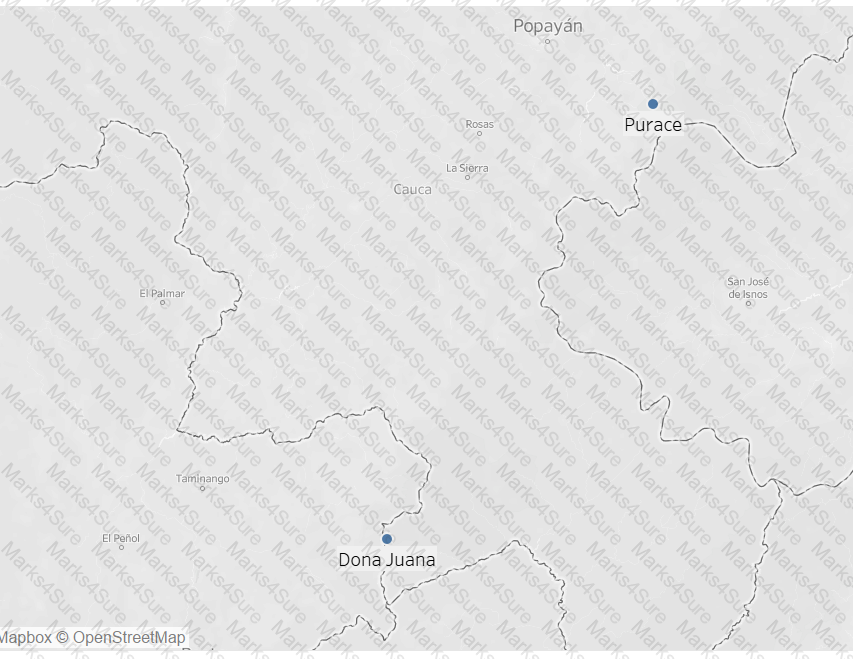 Map
Description automatically generated
Map
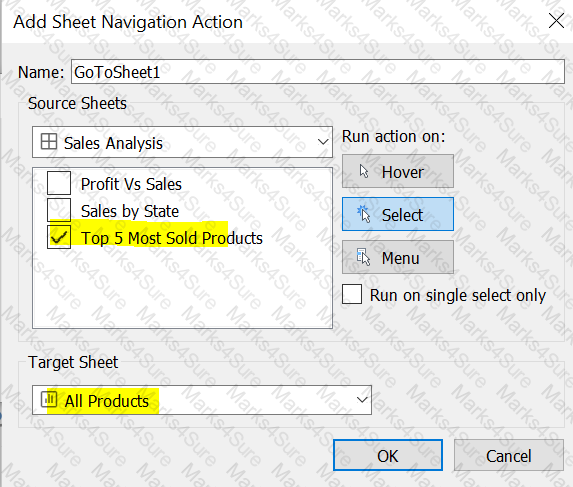
Description automatically generatedUsing the Sales Analysis Dashboard, If you click on any of the products, it should navigate to the All Products worksheet. How you will accomplish it?
 Graphical user interface, application
Description automatically generated
Graphical user interface, application
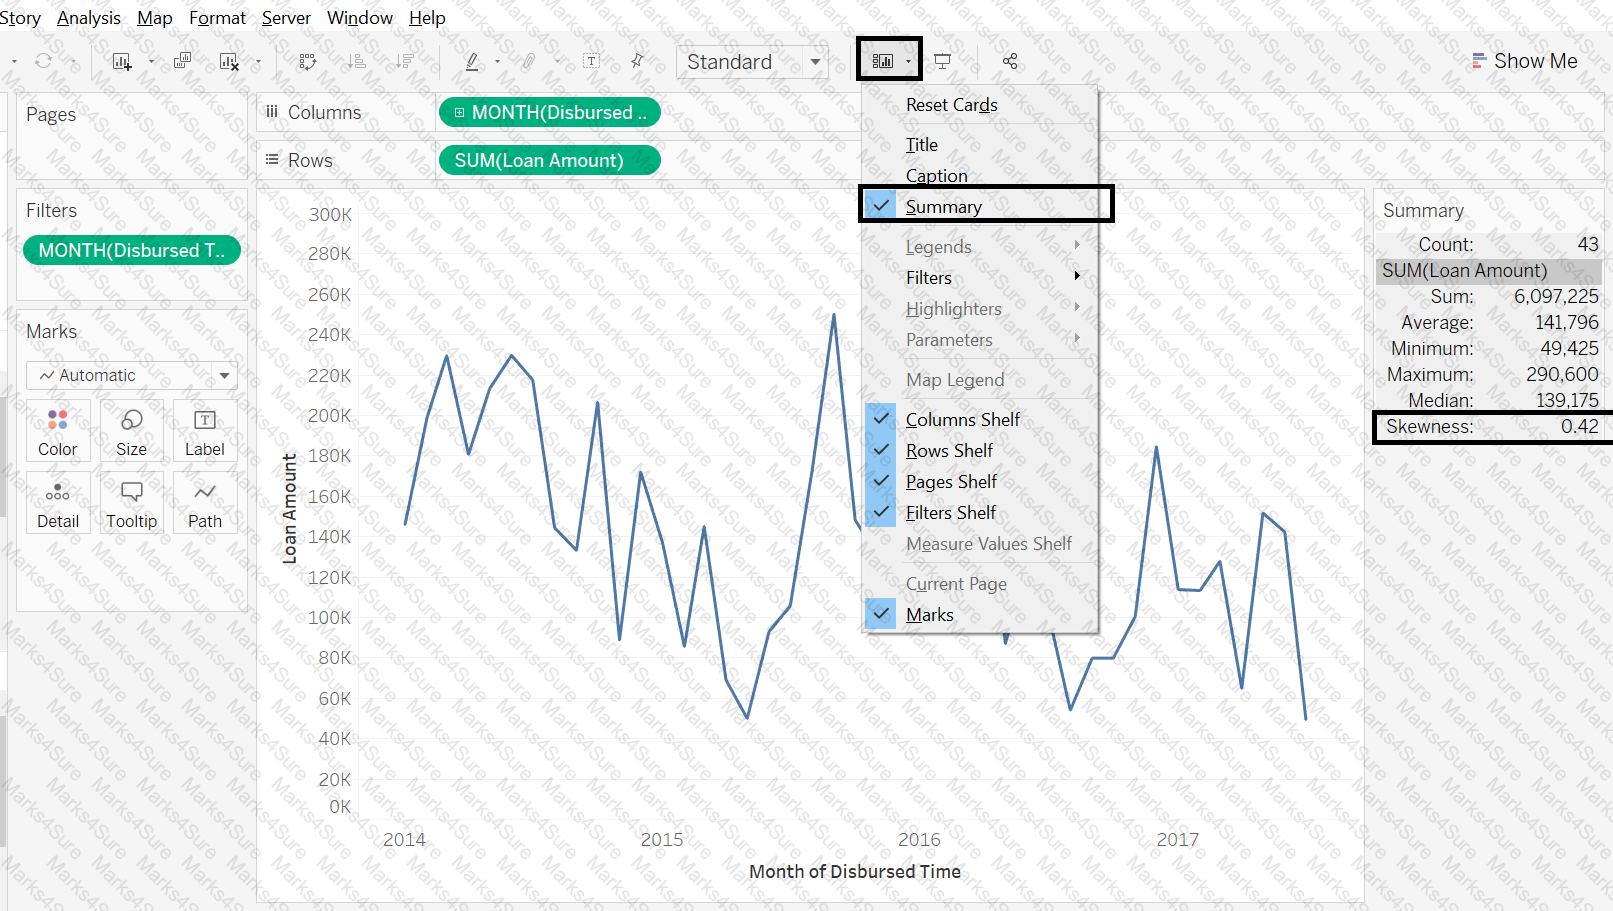
Description automatically generatedConnect to the "Kiva Loans - India" data source, create a chart using the continuous disbursed month (Disbursed Time field) and sum of the loan amount, exclude the null values. What is the skewness of this chart?
 Graphical user interface, chart
Description automatically generated
Graphical user interface, chart
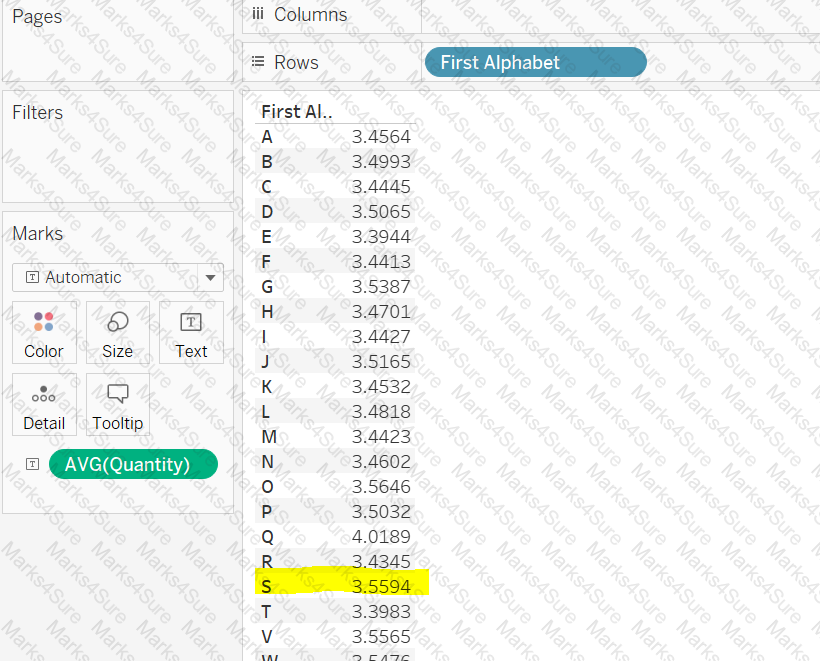
Description automatically generatedConnect to the "Global Superstore" data source and use the Orders table. Find out the average quantity ordered by customers whose first name starts with an 'S' alphabet?
 Graphical user interface, text, application
Description automatically generated
Graphical user interface, text, application
Description automatically generatedConnect to the "Global Superstore" data source and use the Orders table. Predict the profit of January 2016 using the profit data through December 2015. What is the profit value of January 2016?
 Graphical user interface, text, application
Description automatically generated
Graphical user interface, text, application
Description automatically generated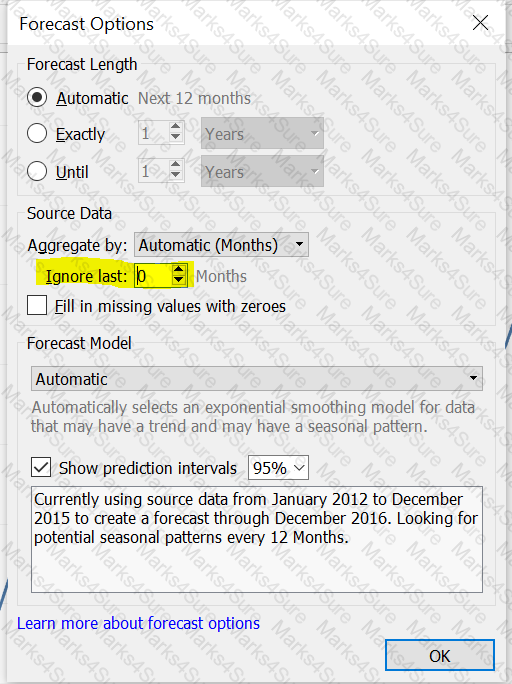 Graphical user interface, text, application
Description automatically generated
Graphical user interface, text, application
Description automatically generated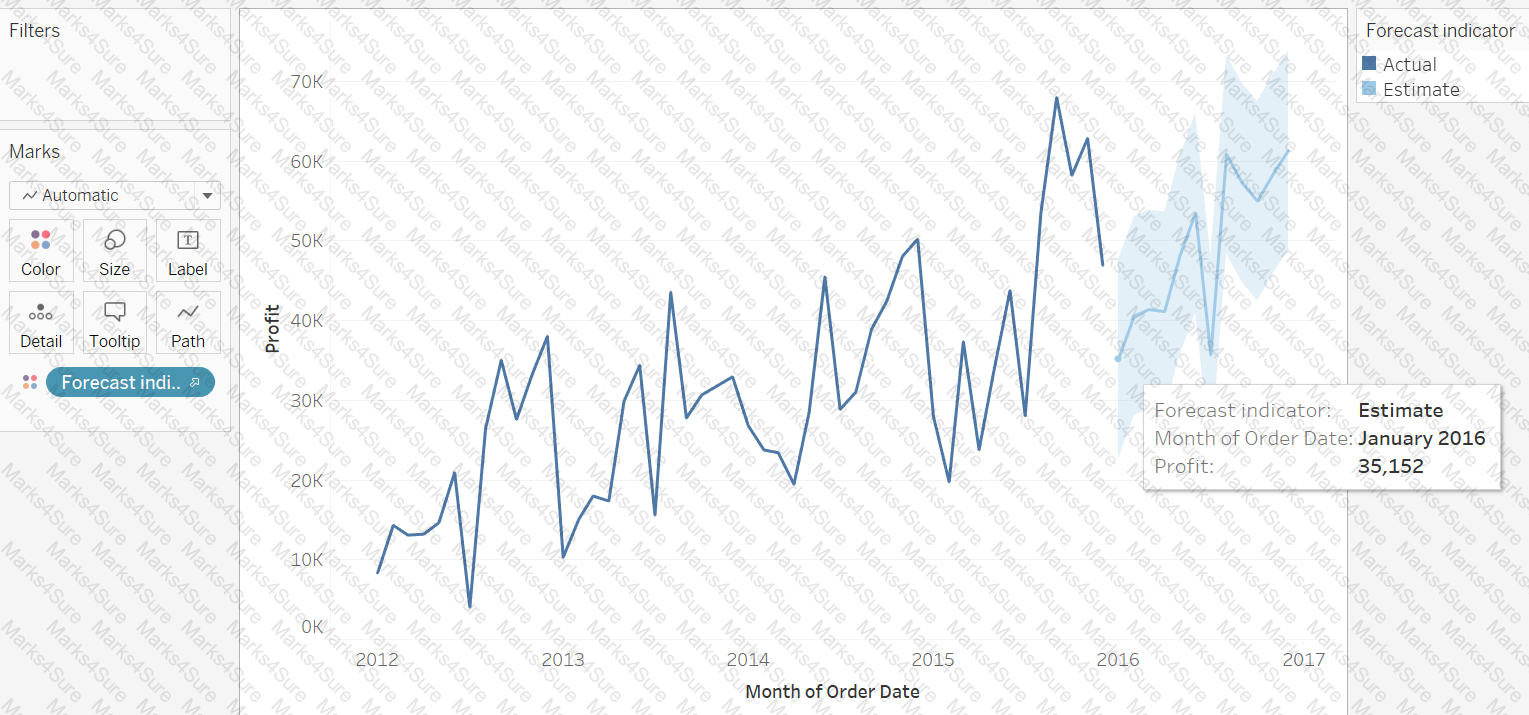 Graphical user interface, chart, line chart
Description automatically generated
Graphical user interface, chart, line chart
Description automatically generated Graphical user interface, application, table
Description automatically generated
Graphical user interface, application, table
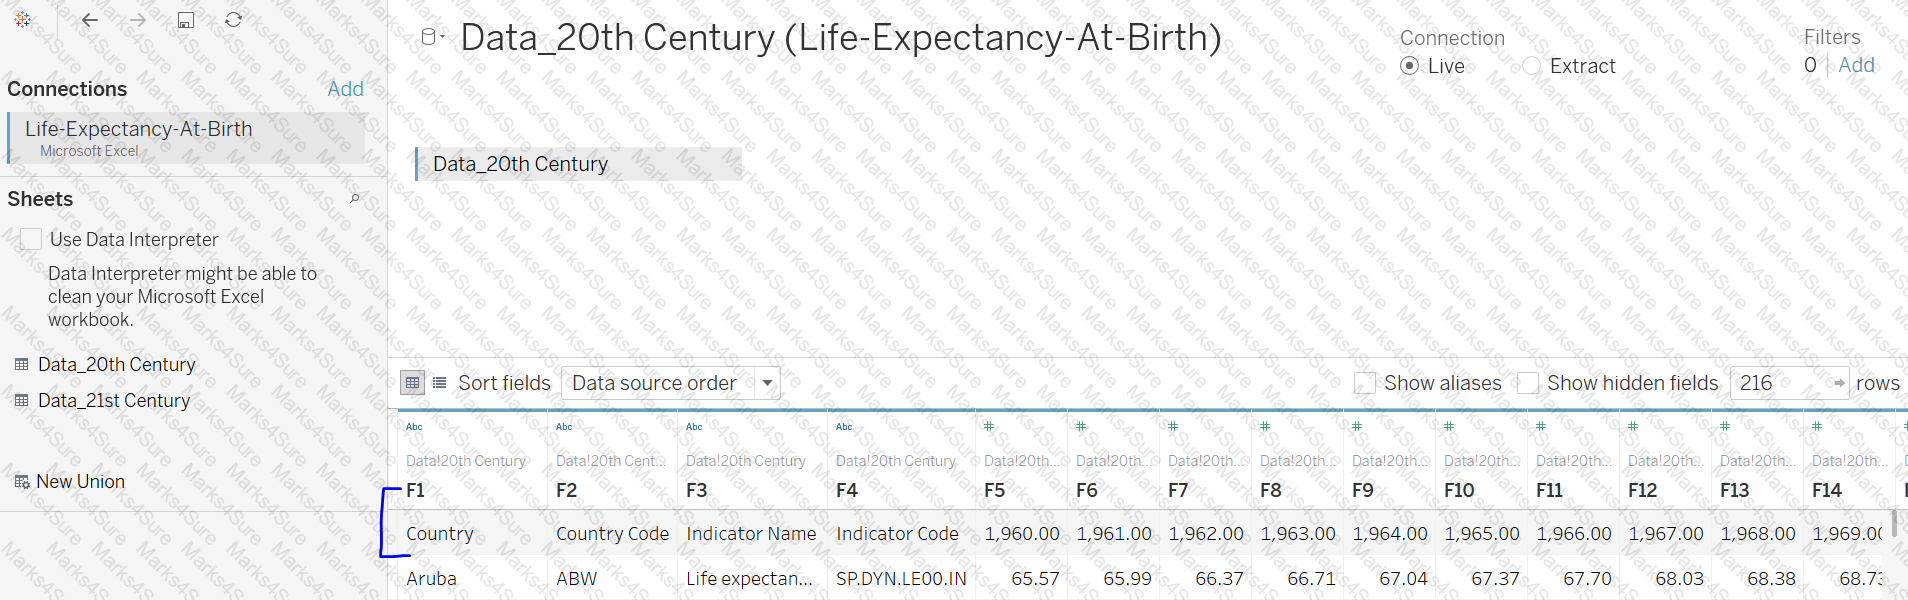
Description automatically generatedConnect to the "Life Expectancy at birth" data source, combine sheets Data_20th century and Data_21st century. Find the moving average for the average life expectancy for 10 years before 2000 and 10 years after 2000 for New Zealand.
 Graphical user interface, application
Description automatically generated
Graphical user interface, application
Description automatically generated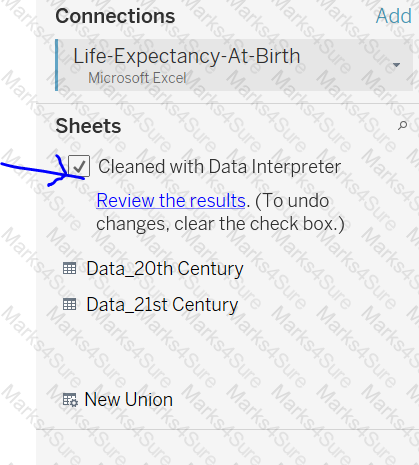 Graphical user interface, text, application
Description automatically generated
Graphical user interface, text, application
Description automatically generated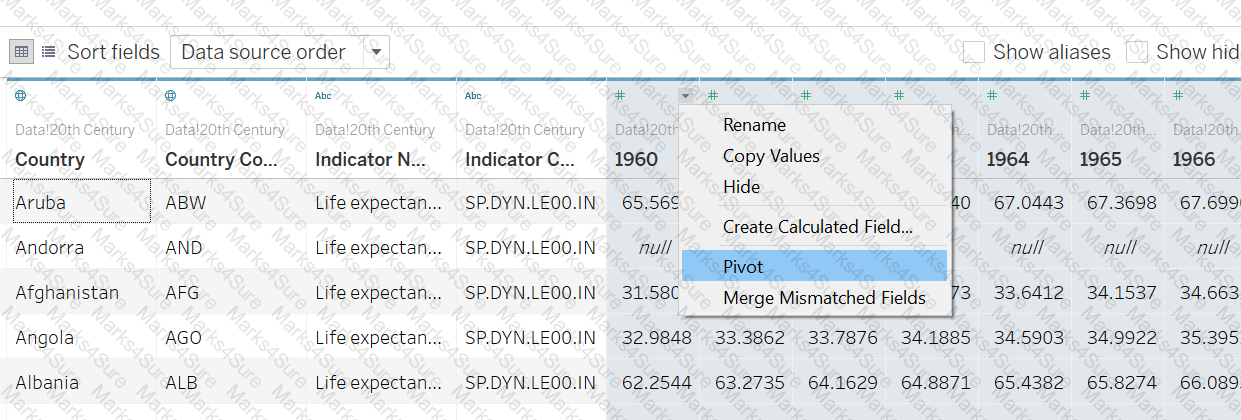 Graphical user interface, text, application
Description automatically generated
Graphical user interface, text, application
Description automatically generated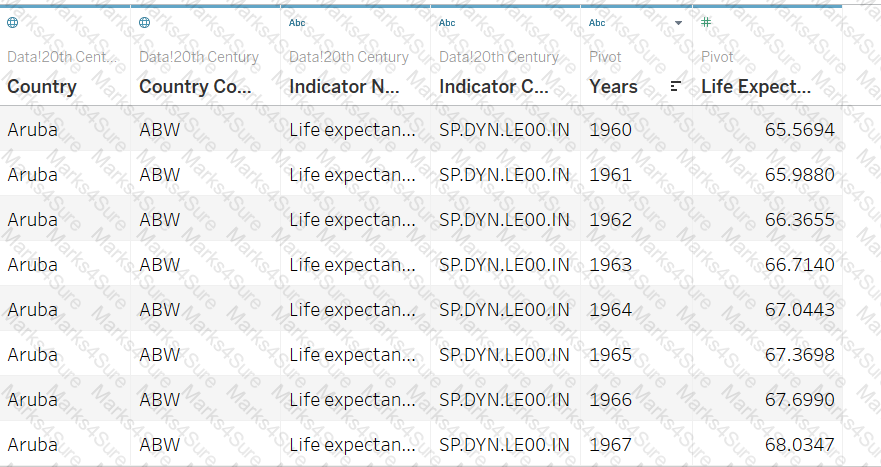 Graphical user interface, application
Description automatically generated
Graphical user interface, application
Description automatically generated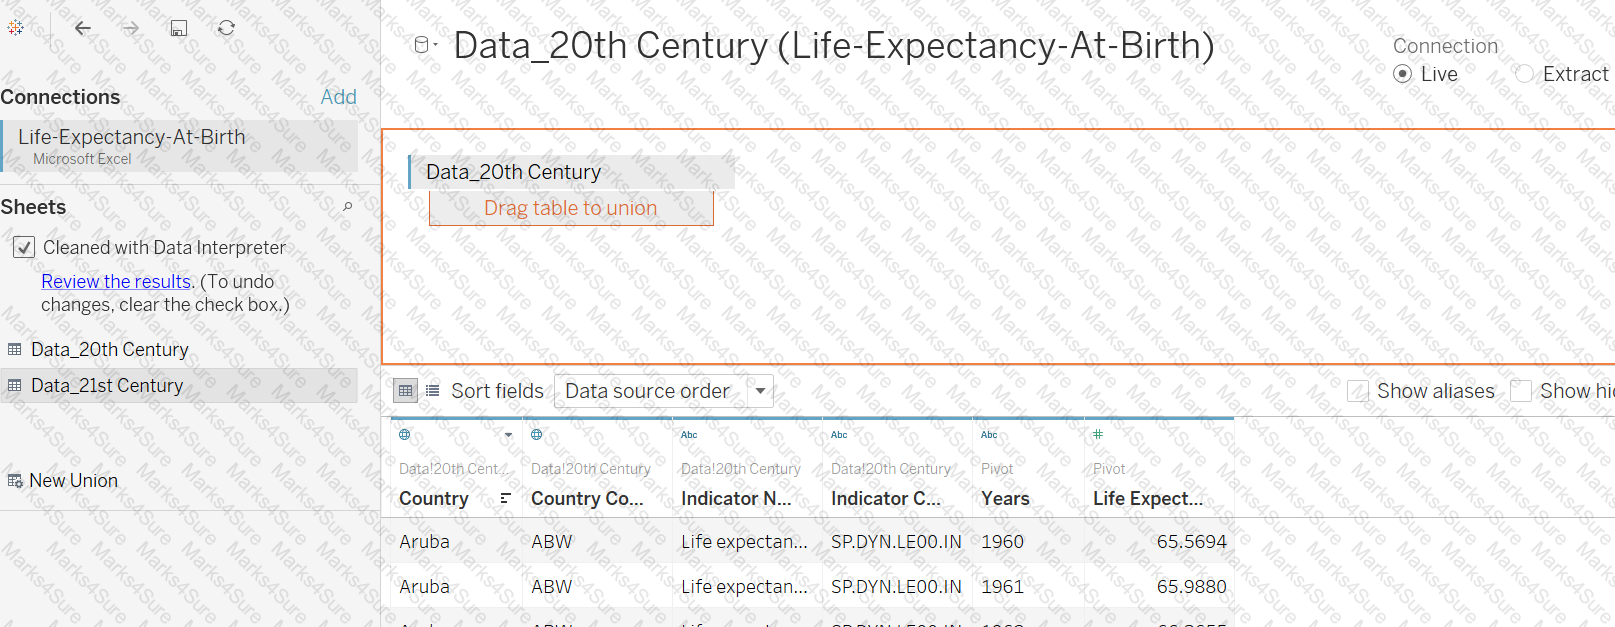 Graphical user interface, text, application, email
Description automatically generated
Graphical user interface, text, application, email
Description automatically generated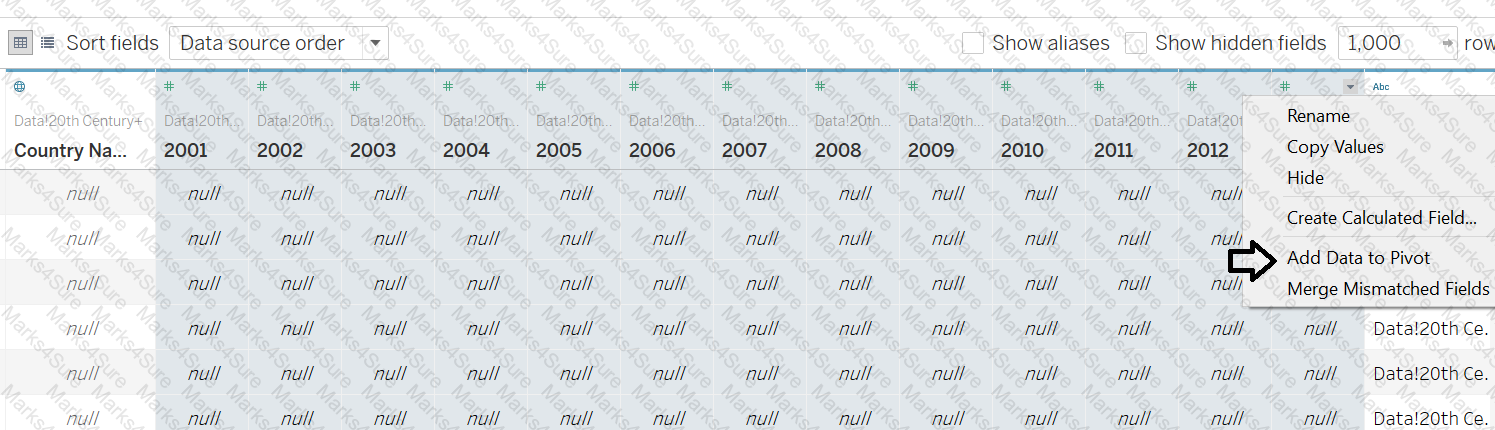 A picture containing graphical user interface
Description automatically generated
A picture containing graphical user interface
Description automatically generated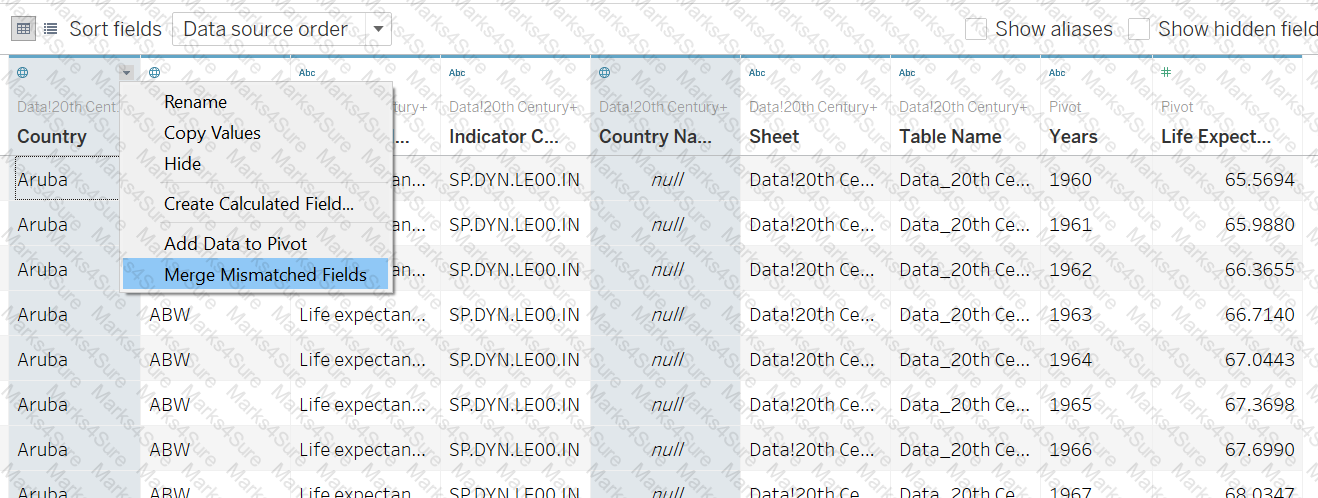 Graphical user interface, application
Description automatically generated
Graphical user interface, application
Description automatically generated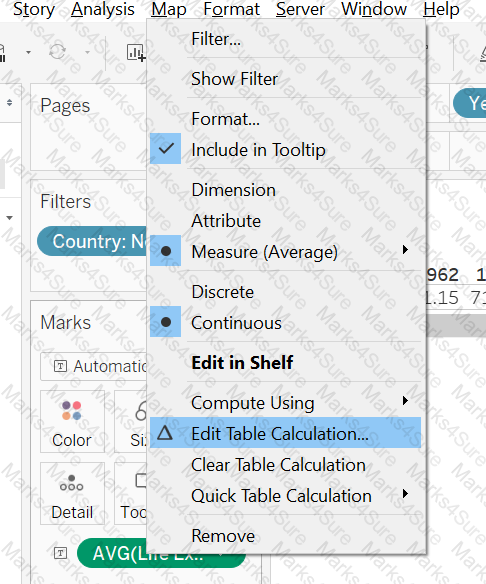 Graphical user interface, application
Description automatically generated
Graphical user interface, application
Description automatically generated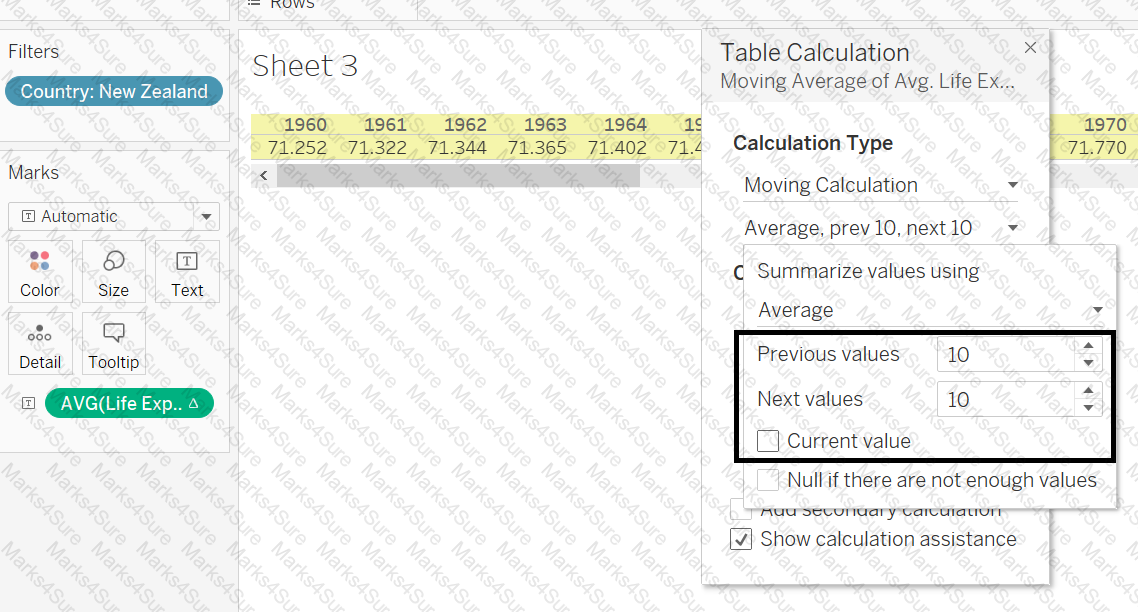 Graphical user interface, application, Word
Description automatically generated
Graphical user interface, application, Word
Description automatically generated Graphical user interface, application, Word
Description automatically generated
Graphical user interface, application, Word
Description automatically generatedWhile creating which of the chart type, we turn off the stack marks from the analysis menu?
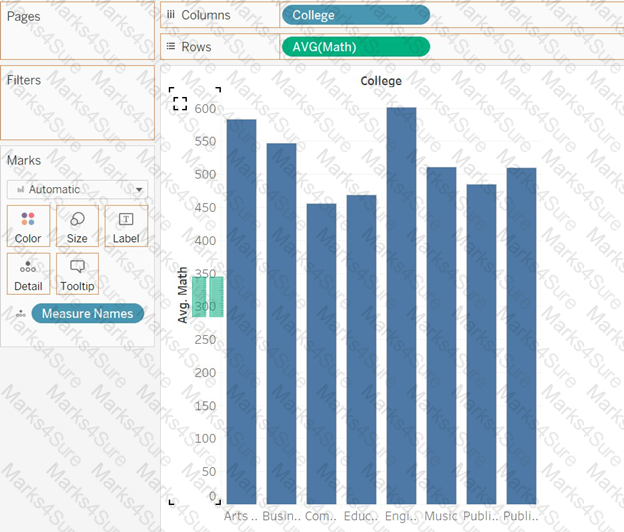
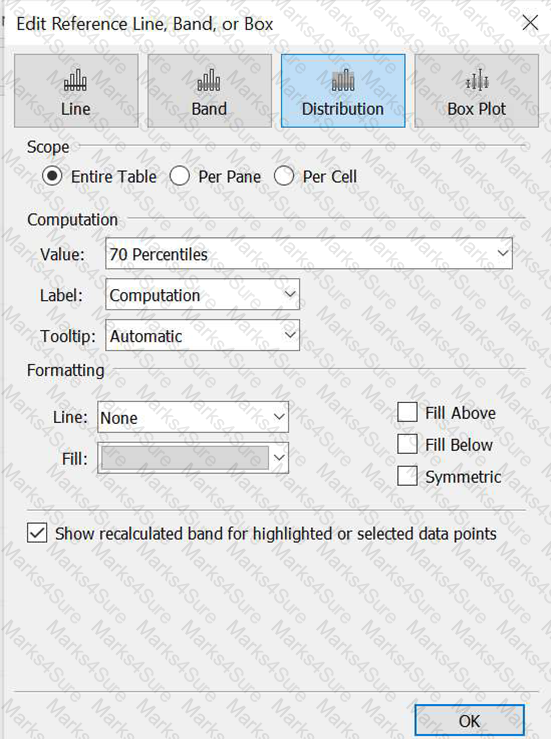
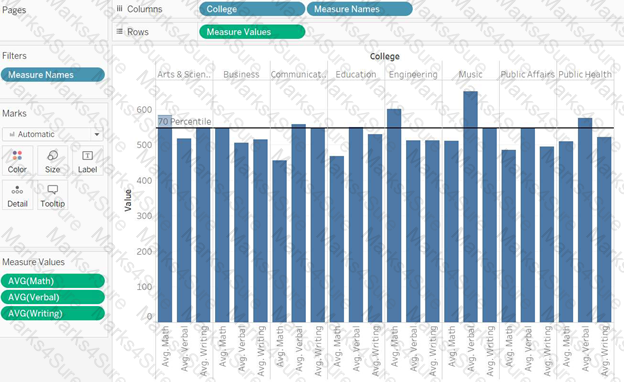
Connect to the "Education" data source. Which college(s) average math, verbal, and writing scores are lesser than the overall 70% percentile in these subjects?
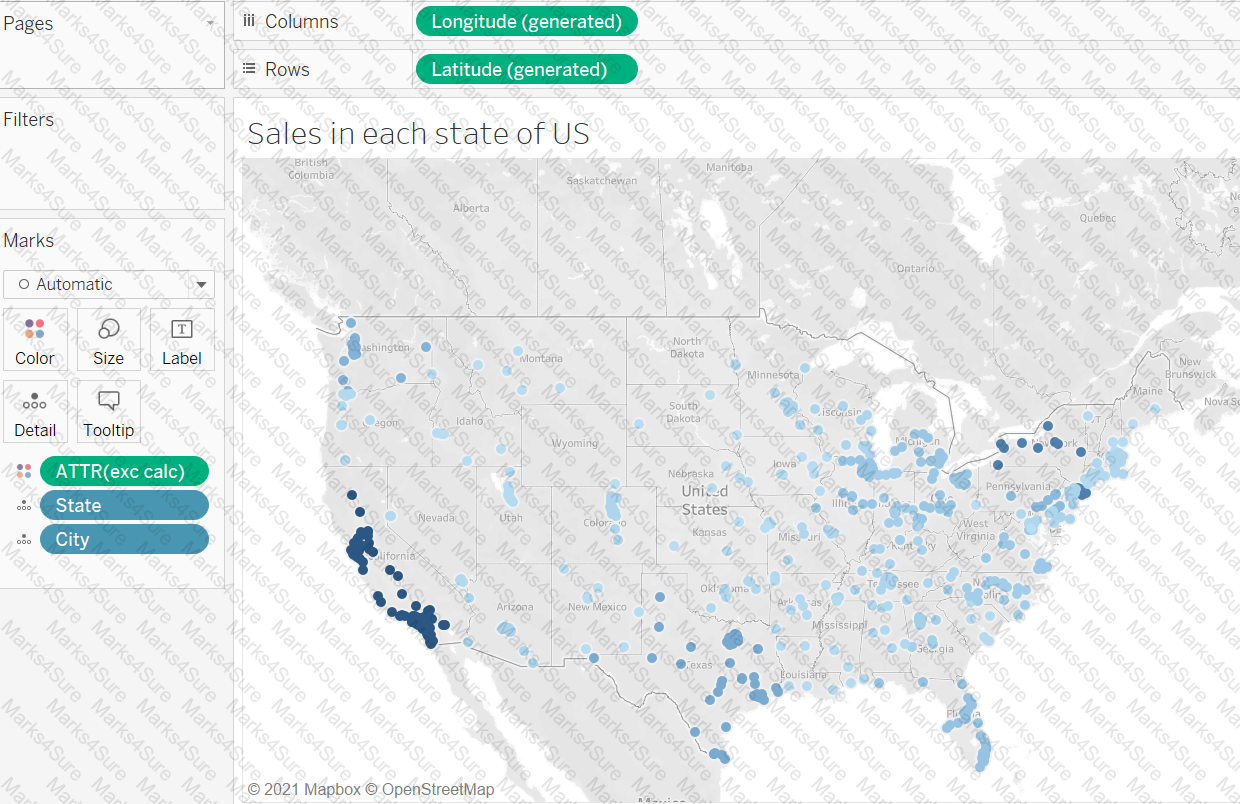
Which calculation will color the sales by state, while the city is on the Marks card, as shown in this view?
Larger image
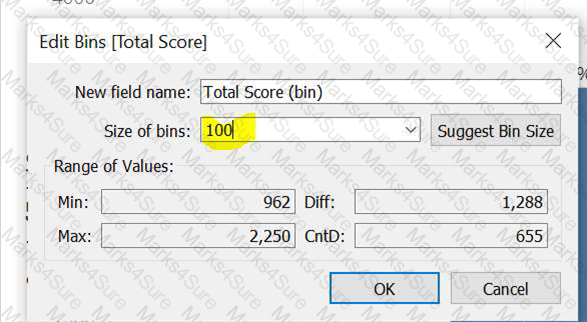
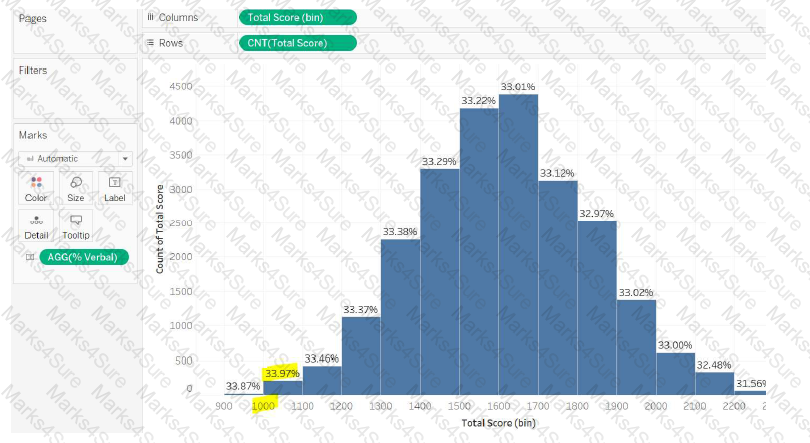
Connect to the "Education" data source. Create a histogram using the Total score field and having a bin size of 100. Find out in which bin the students scored the highest verbal percentage? [Note: Verbal percentage should be calculated by considering how many marks scored in the verbal out of the total marks scored.]

 Chart, histogram
Description automatically generated
Chart, histogram
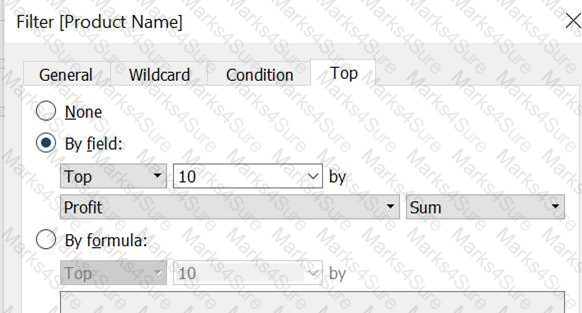
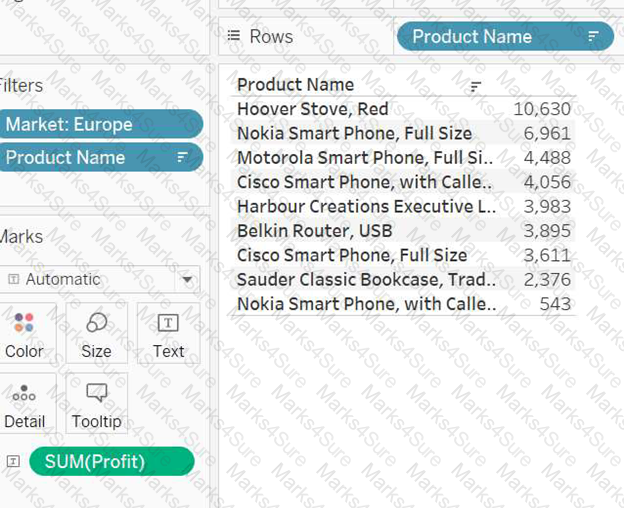
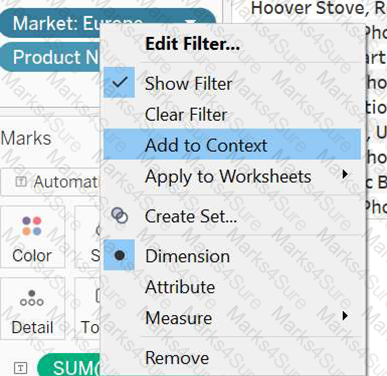
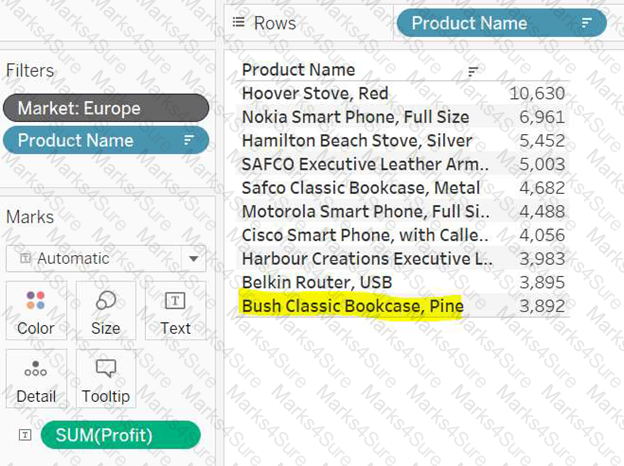
Description automatically generatedConnect to the "Global Superstore" data source and use the Orders table. Create a filter on a product name to find out the top 10 profitable products. Create a crosstab to show these products along with profit value. Now filter this chart to show only the products from the European market. What is the 10th most profitable product?
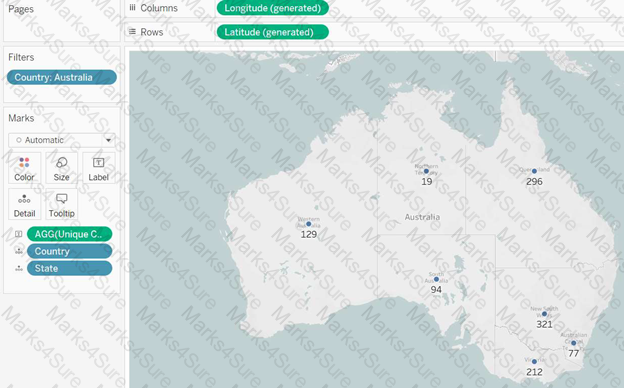
Connect to the "Global Superstore" data source and use the Orders table. Create a map that shows the number of unique customers in Australia. Find the state of Queensland. Which neighboring state has the minimum number of unique customers?

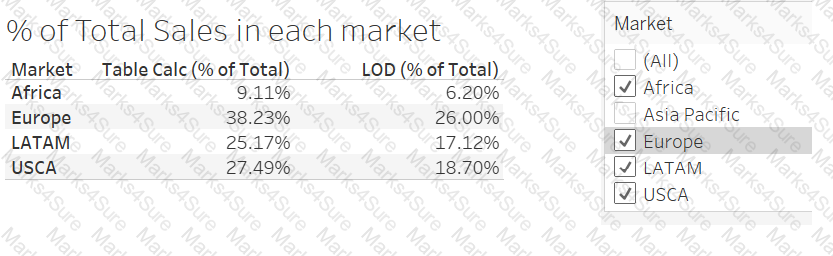
Why might this LOD expression for percent of total sales give different results than a table calculation for percent of total sales?
Larger image
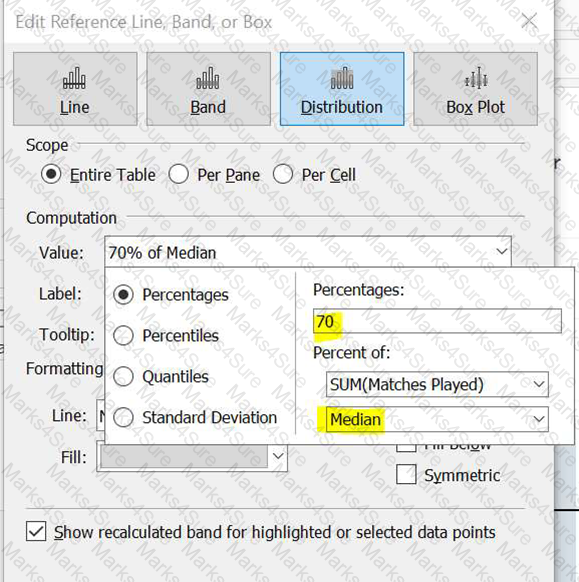
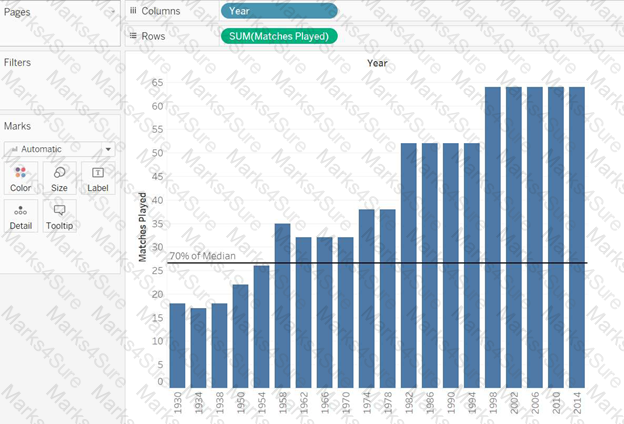
Connect to the "World Cup Results" and use table WorldCups. Create a bar graph using the Year and Matches Played. For how many years the number of matches played was less than 70% of the median?
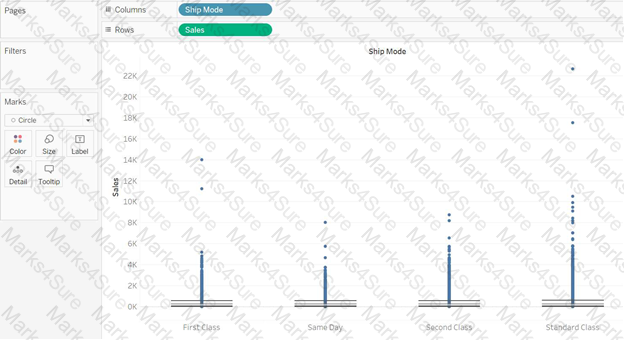
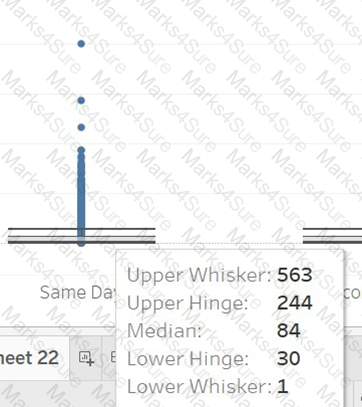
Connect to the "Global Superstore" data source and use the Orders table. Create a box-plots to show the sales distribution for each ship mode. Which of the following ship modes have the same median?
PDF + Testing Engine

Testing Engine
PDF (Q&A)