Free Practice Questions for the Tableau Desktop Specialist Desktop-Specialist Exam (2026 Updated)
At Marks4sure, we are dedicated to providing IT professionals with the most accurate and reliable preparation materials for the Tableau Desktop-Specialist exam. To support your certification journey, we have made a selection of our premium 2026 Tableau Desktop Specialist practice questions and answers available completely free. You can take this practice test as many times as you need. Every question includes a detailed, expertly verified explanation to ensure you fully grasp the core security concepts before test day.
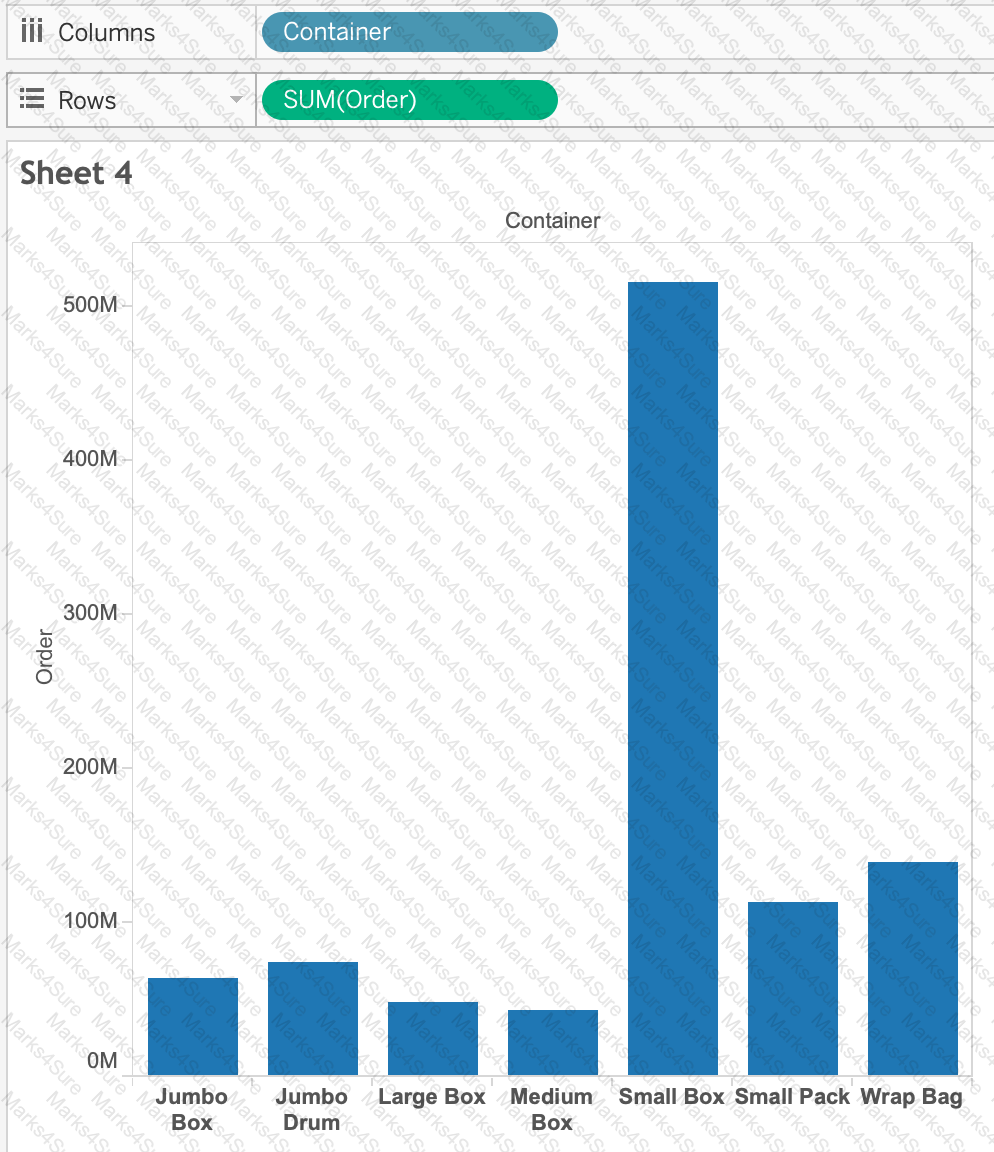
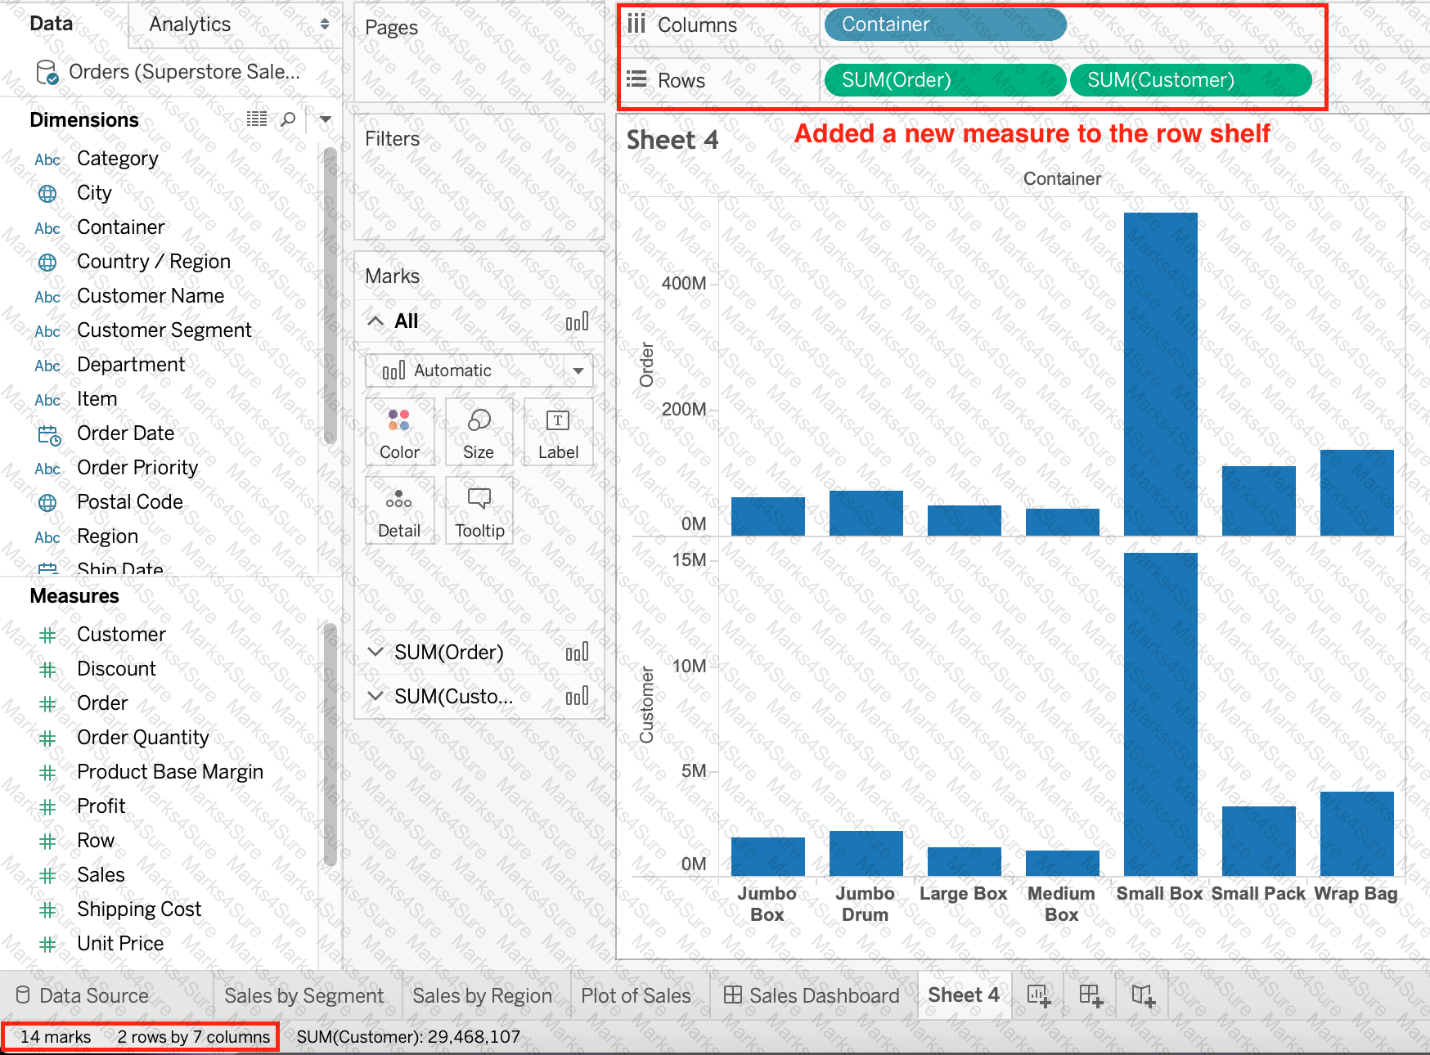
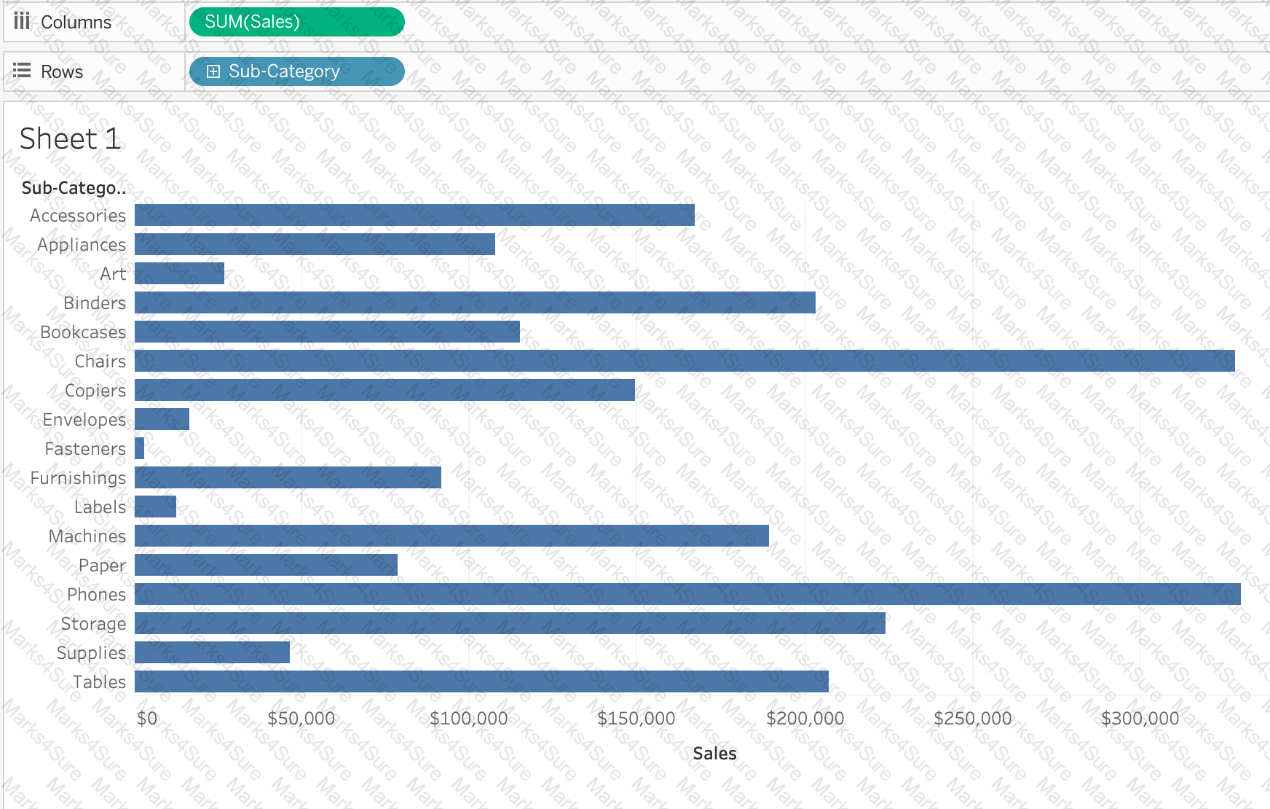
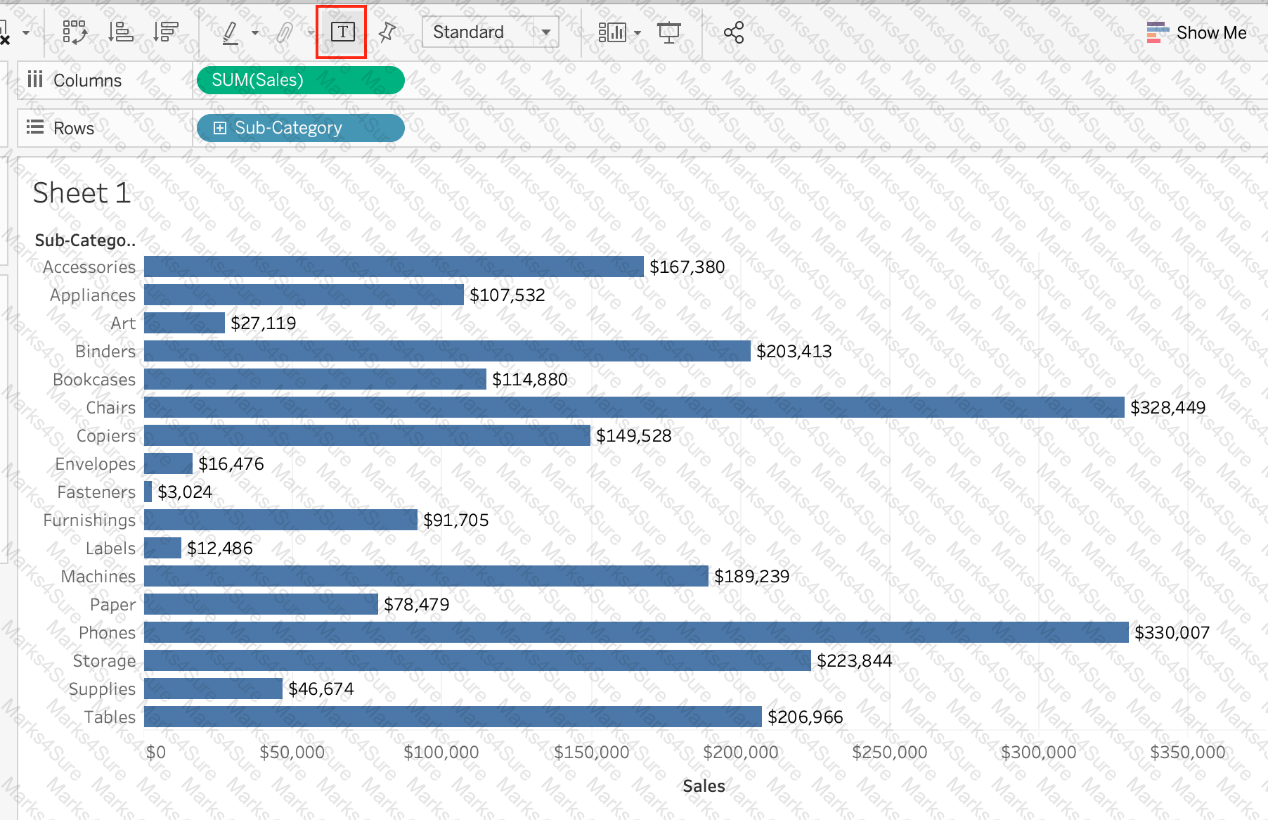
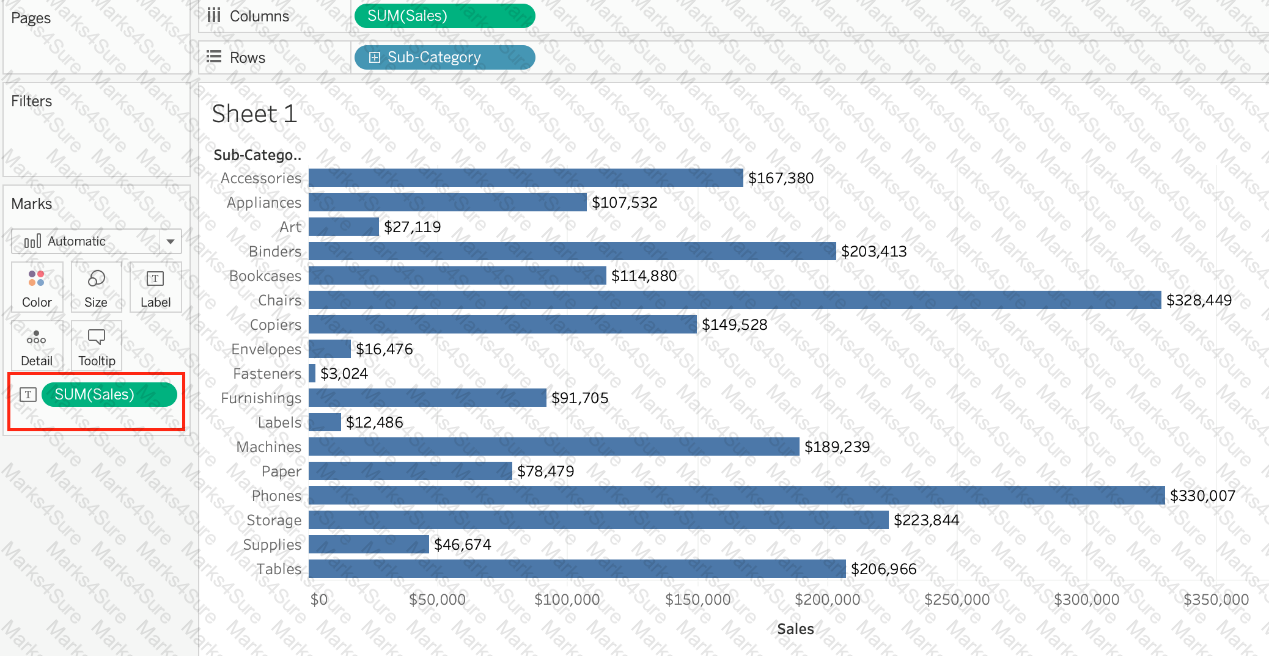
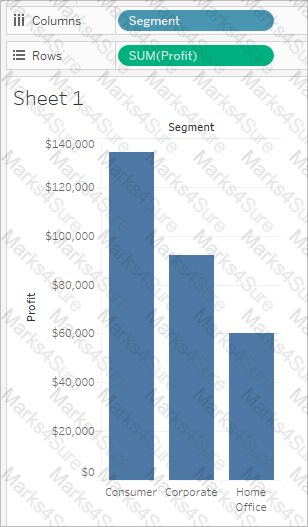
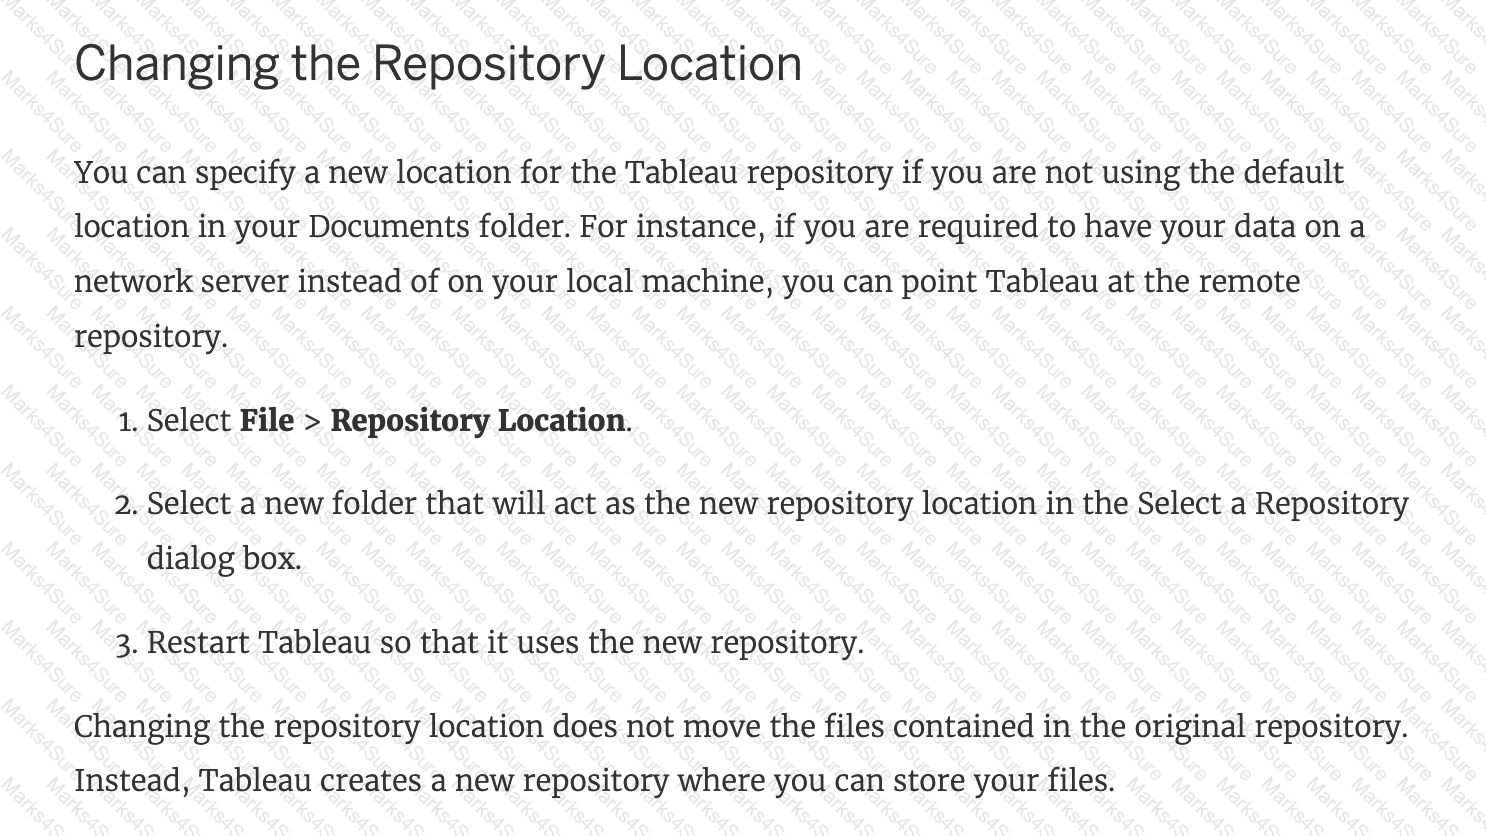
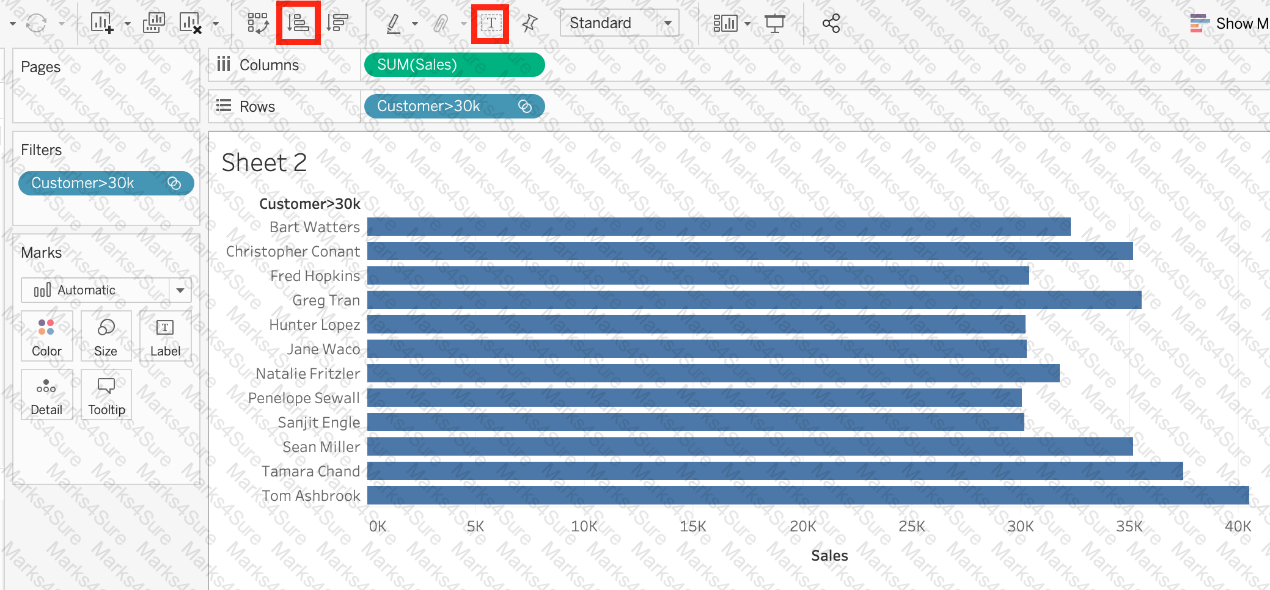
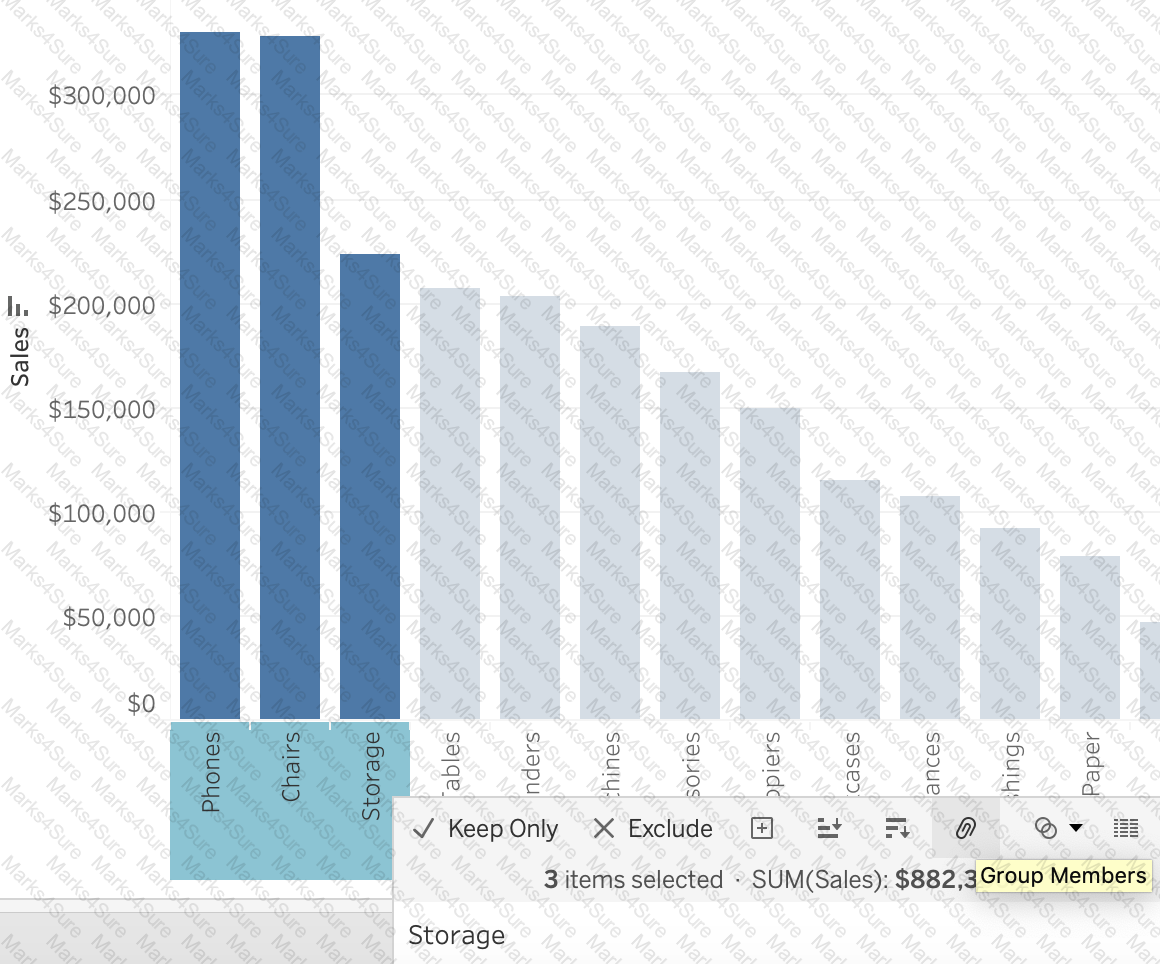
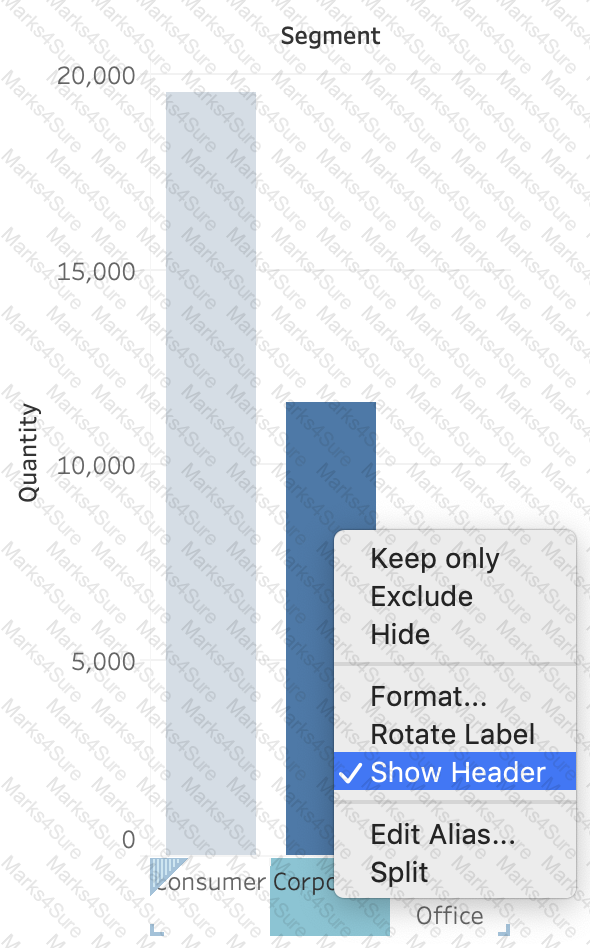
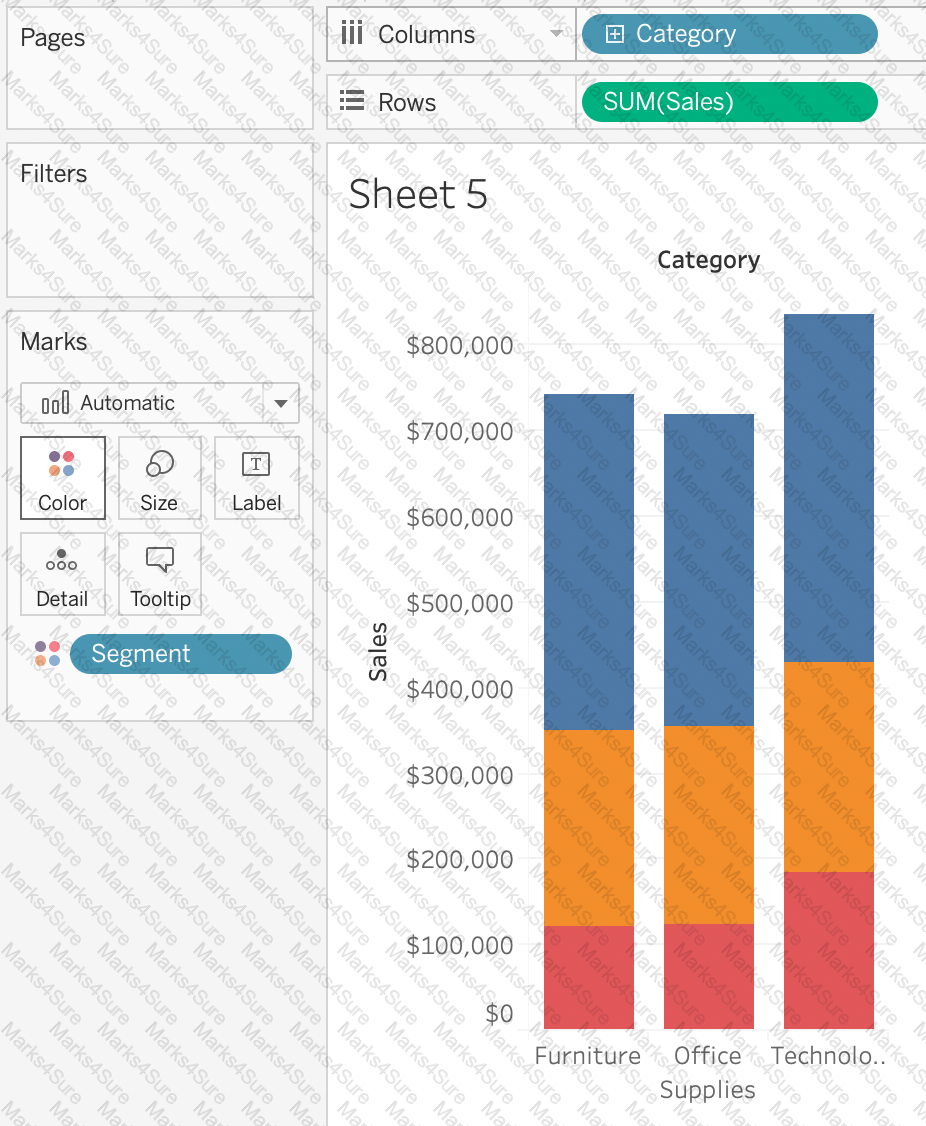
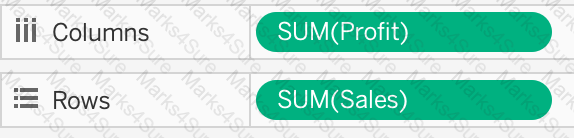
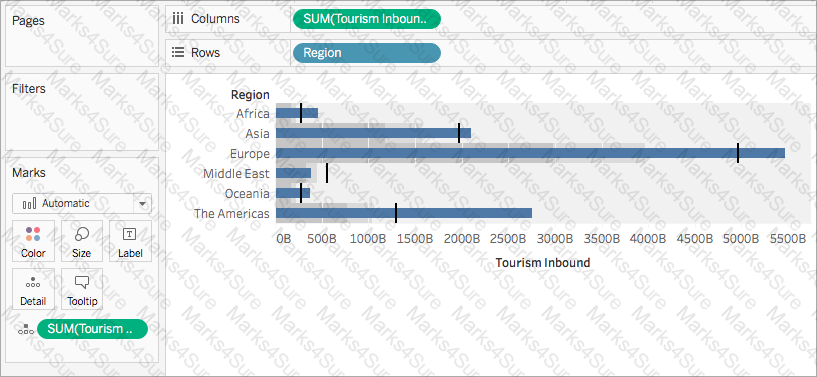
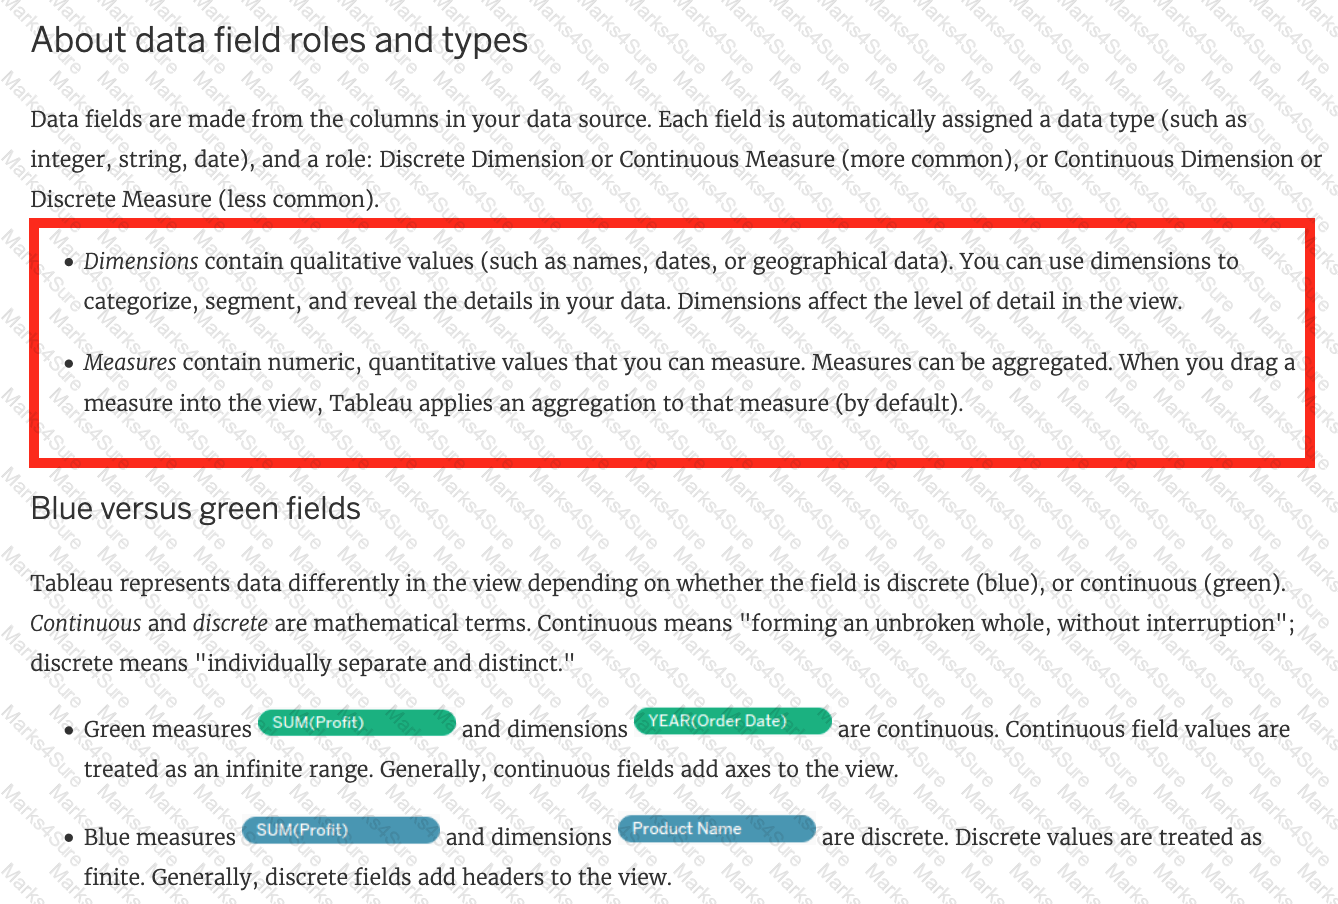
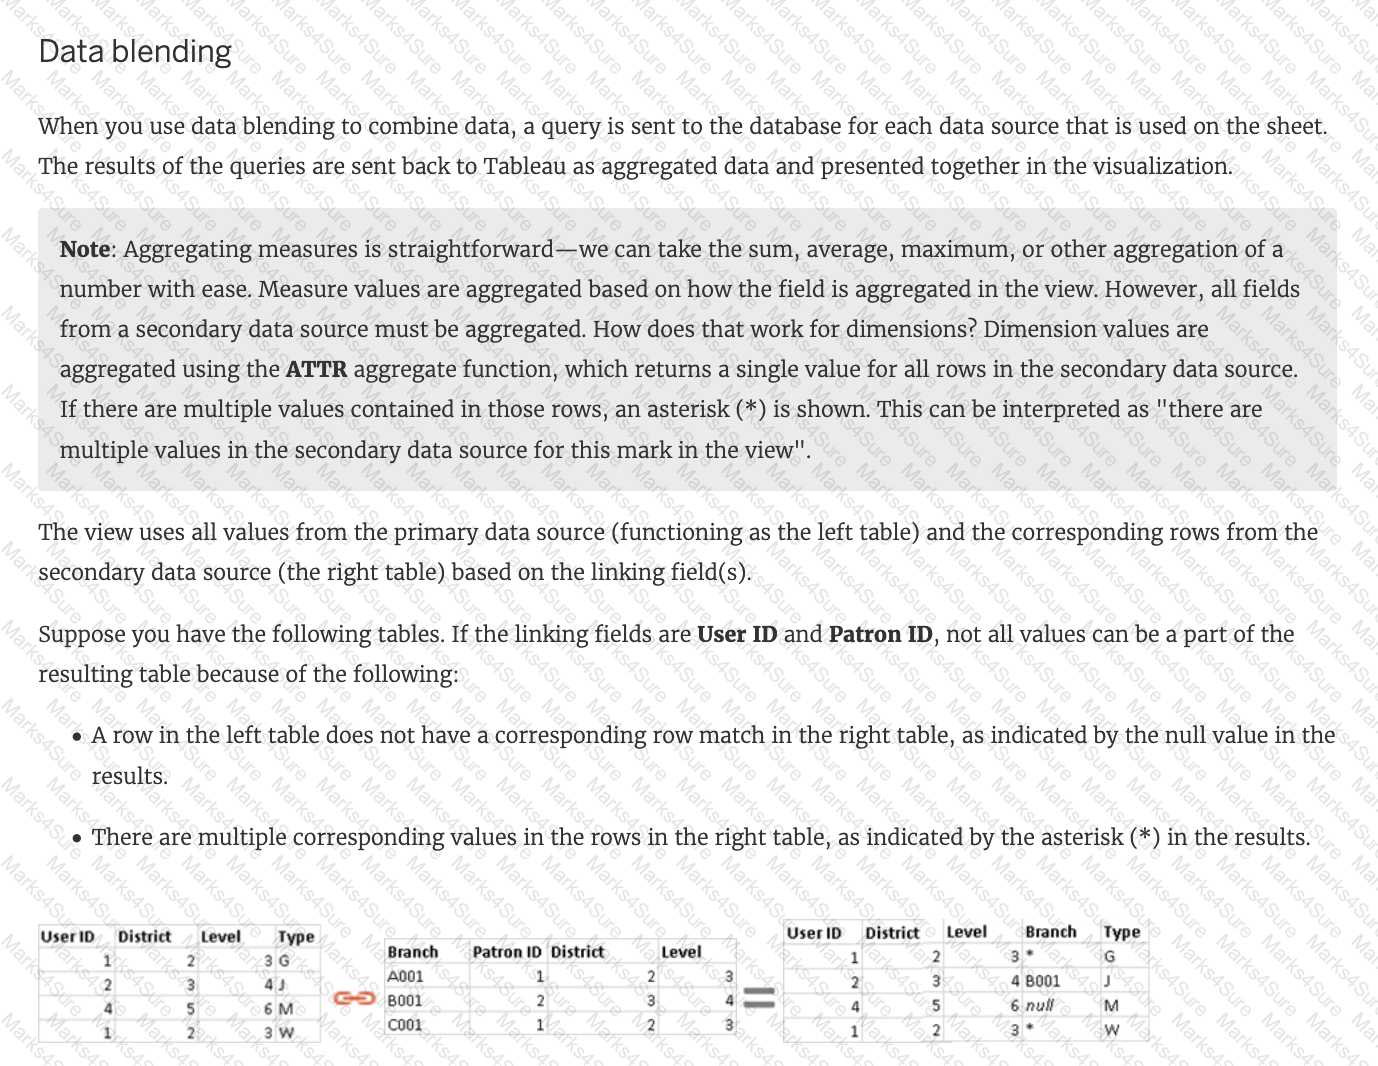
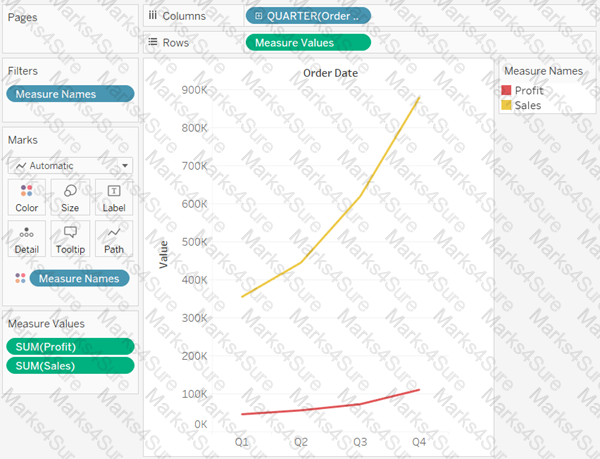
Suppose I have the following view. What will be the total number of marks if I drag a new measure to the row shelf vs the column shelf?
 Graphical user interface, chart, bar chart
Description automatically generated with medium confidence
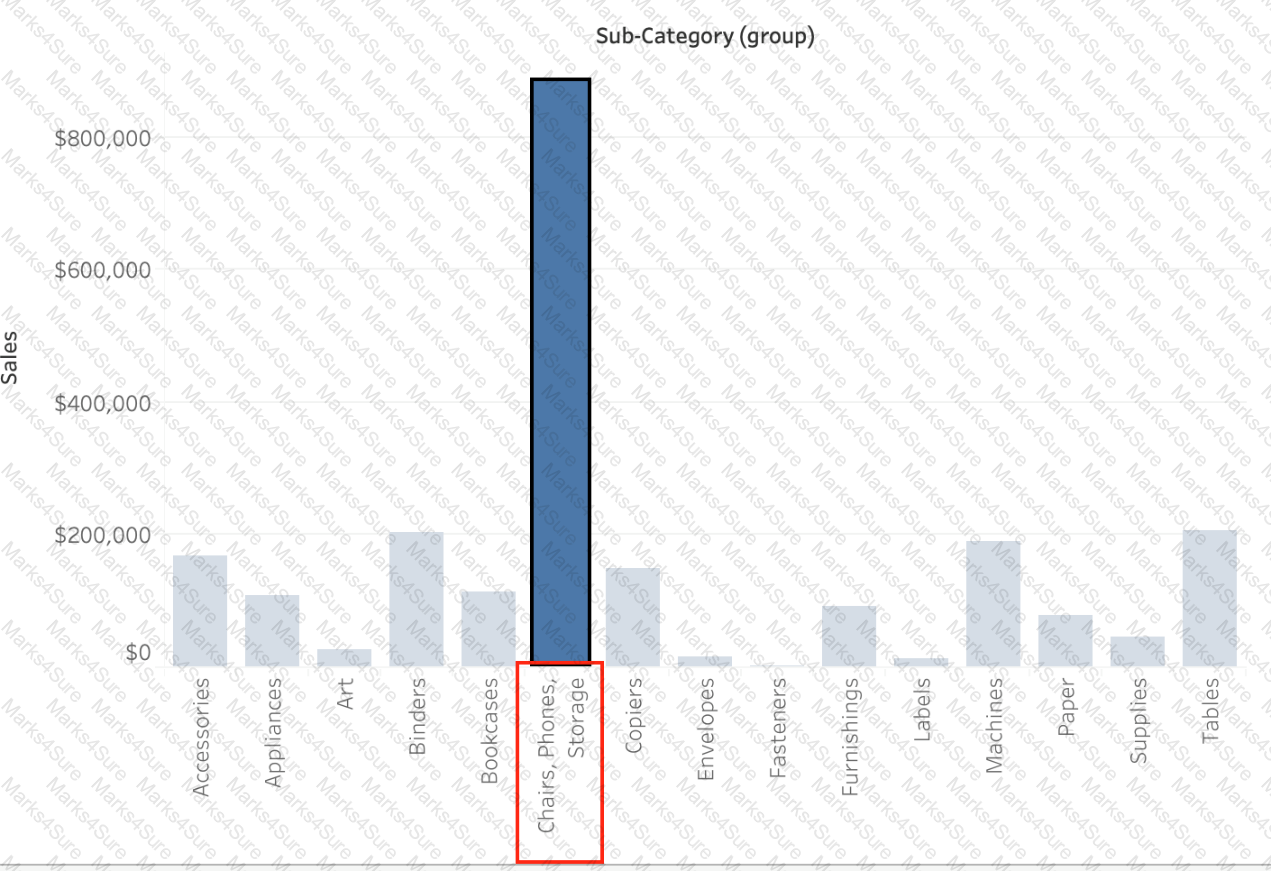
Graphical user interface, chart, bar chart
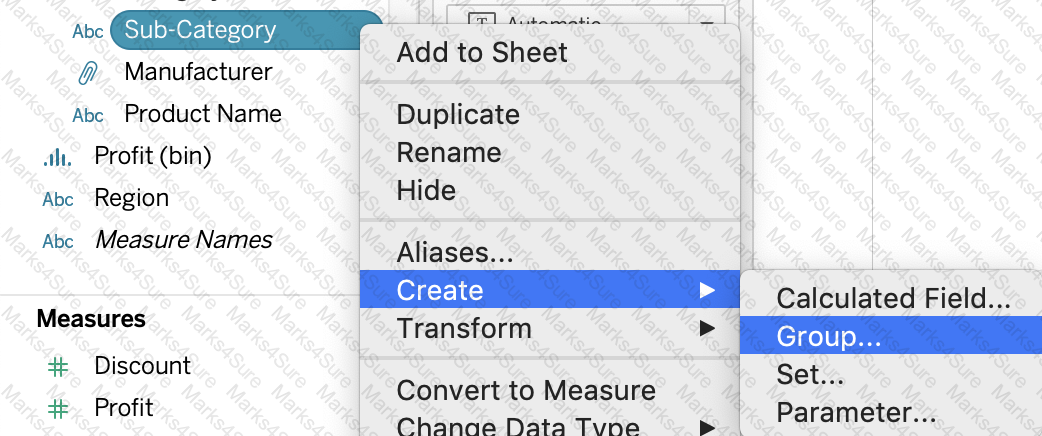
Description automatically generated with medium confidence Graphical user interface, text, application
Description automatically generated
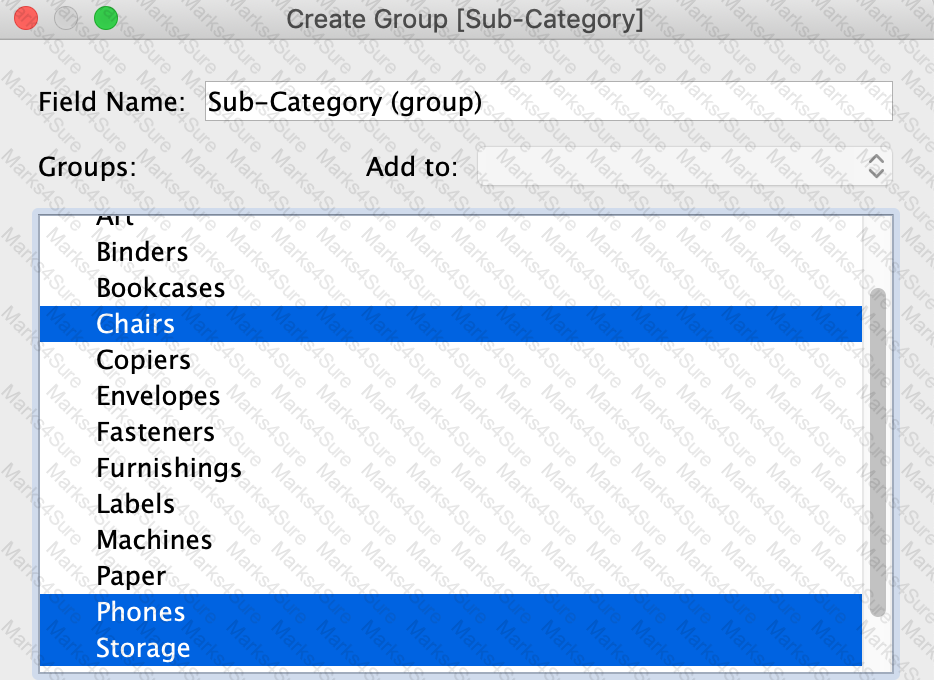
Graphical user interface, text, application
Description automatically generated
Which of the following are correct ways to define a join in Tableau version 2020.3 and above?

_______________ enables us to create workbooks and views, dashboards, and data sources in Tableau Desktop, and then publish this content to our own server.
Question 45: Skipped
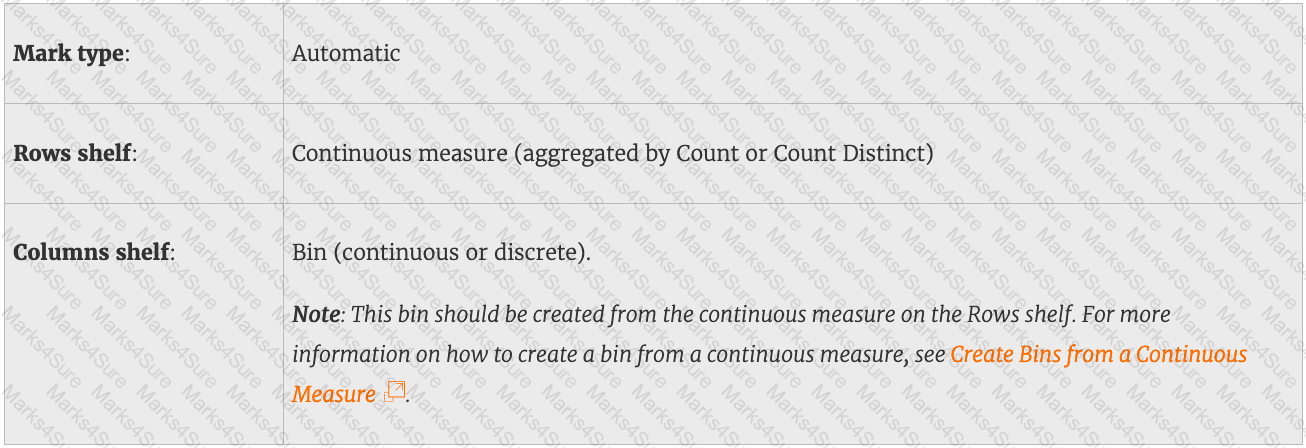
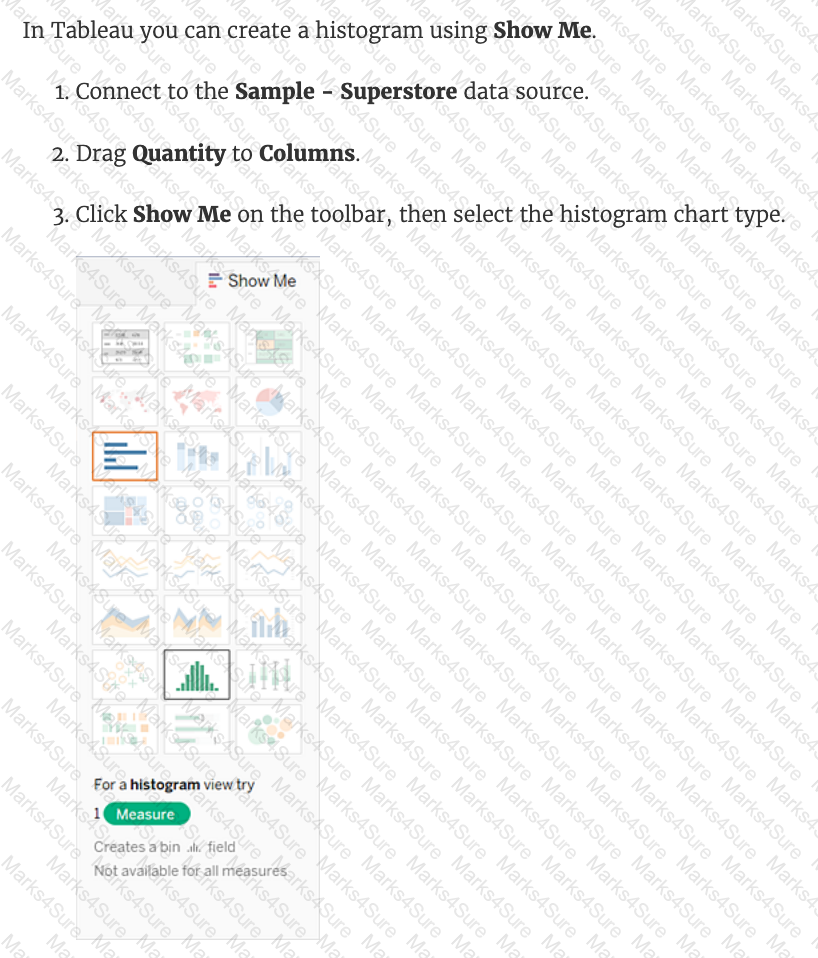
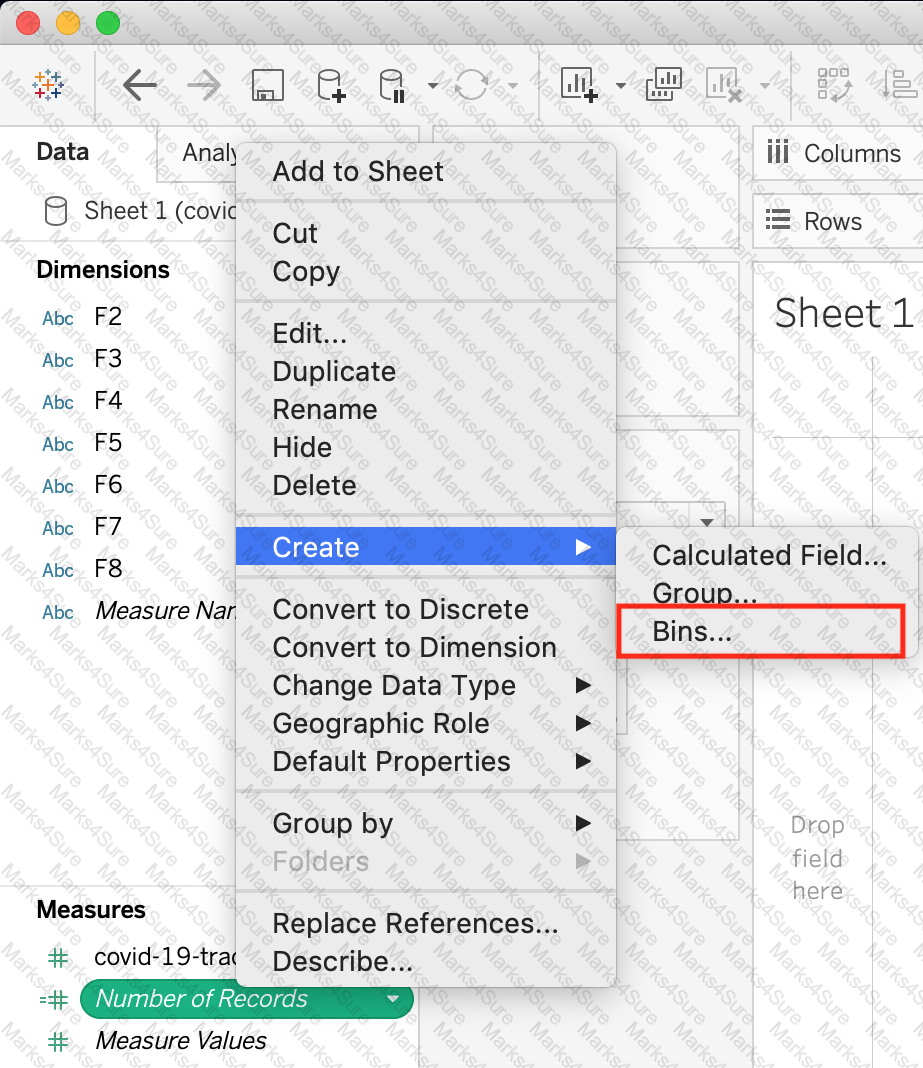
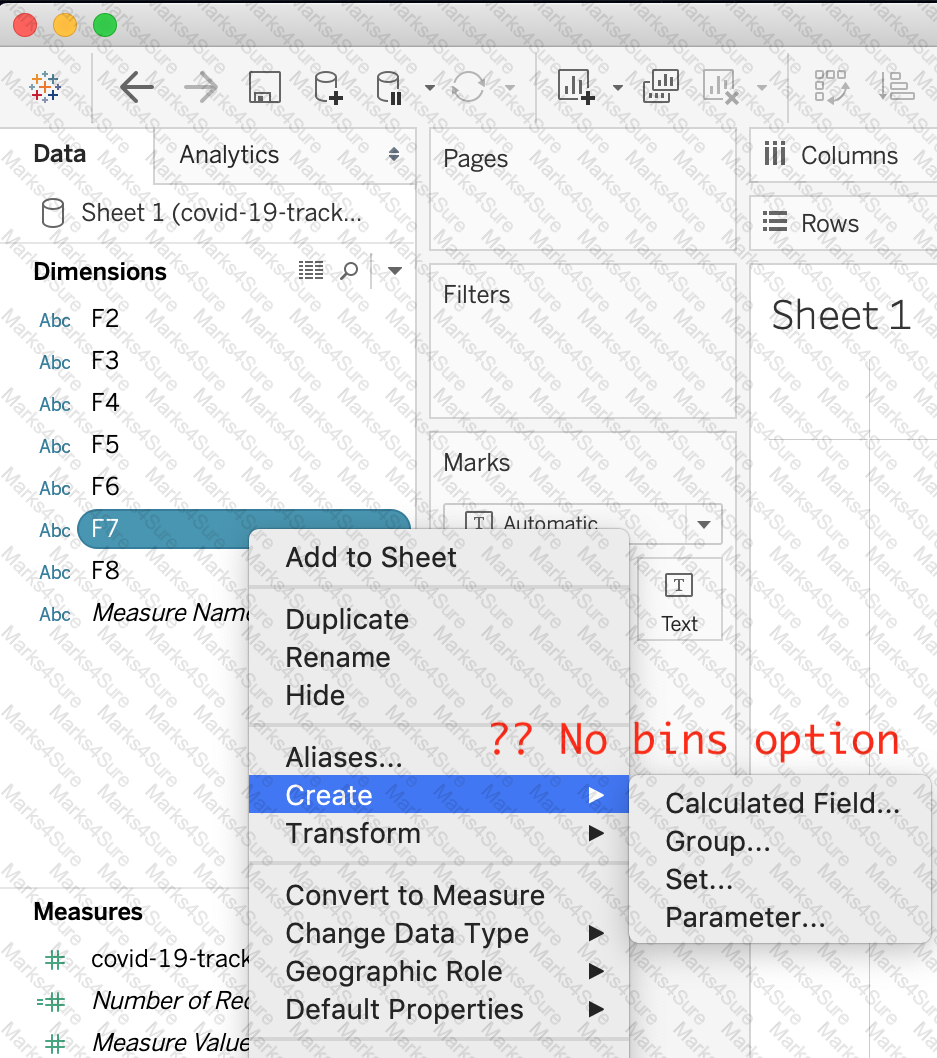
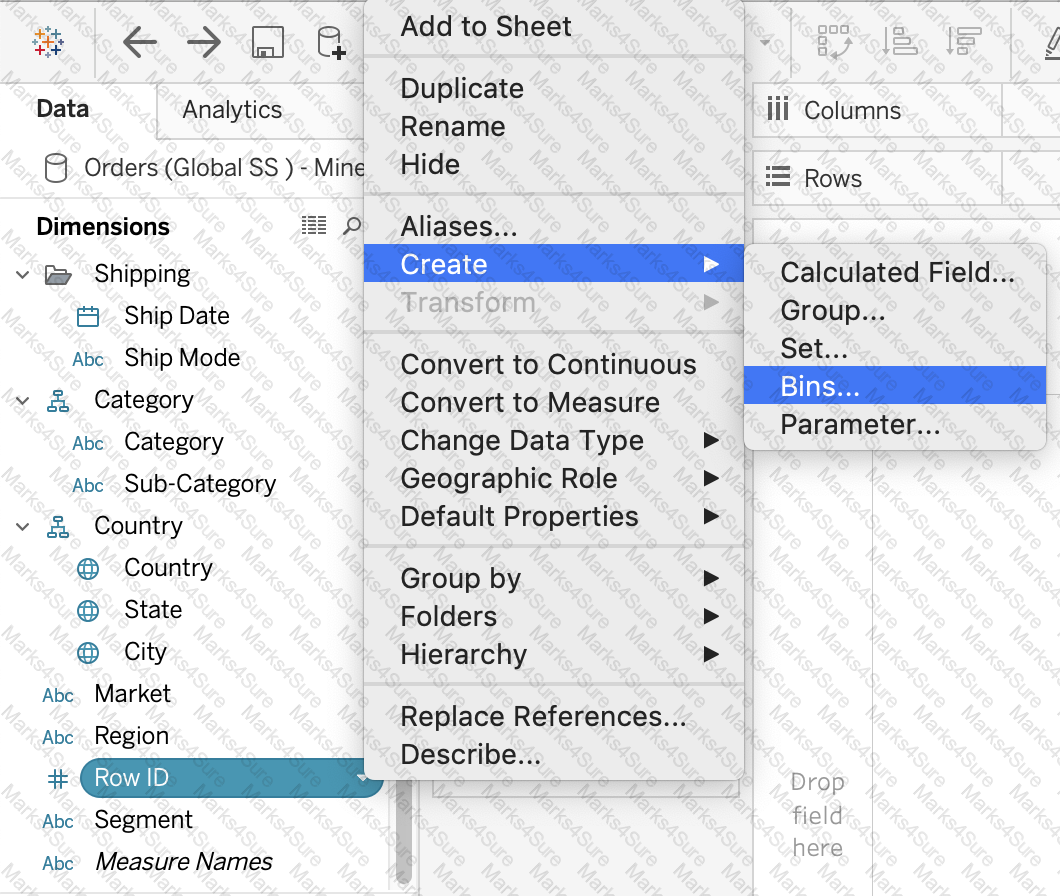
You have just created a histogram and now want to be able to change the size of bins dynamically. Using which of the following will easily satisfy your requirement?
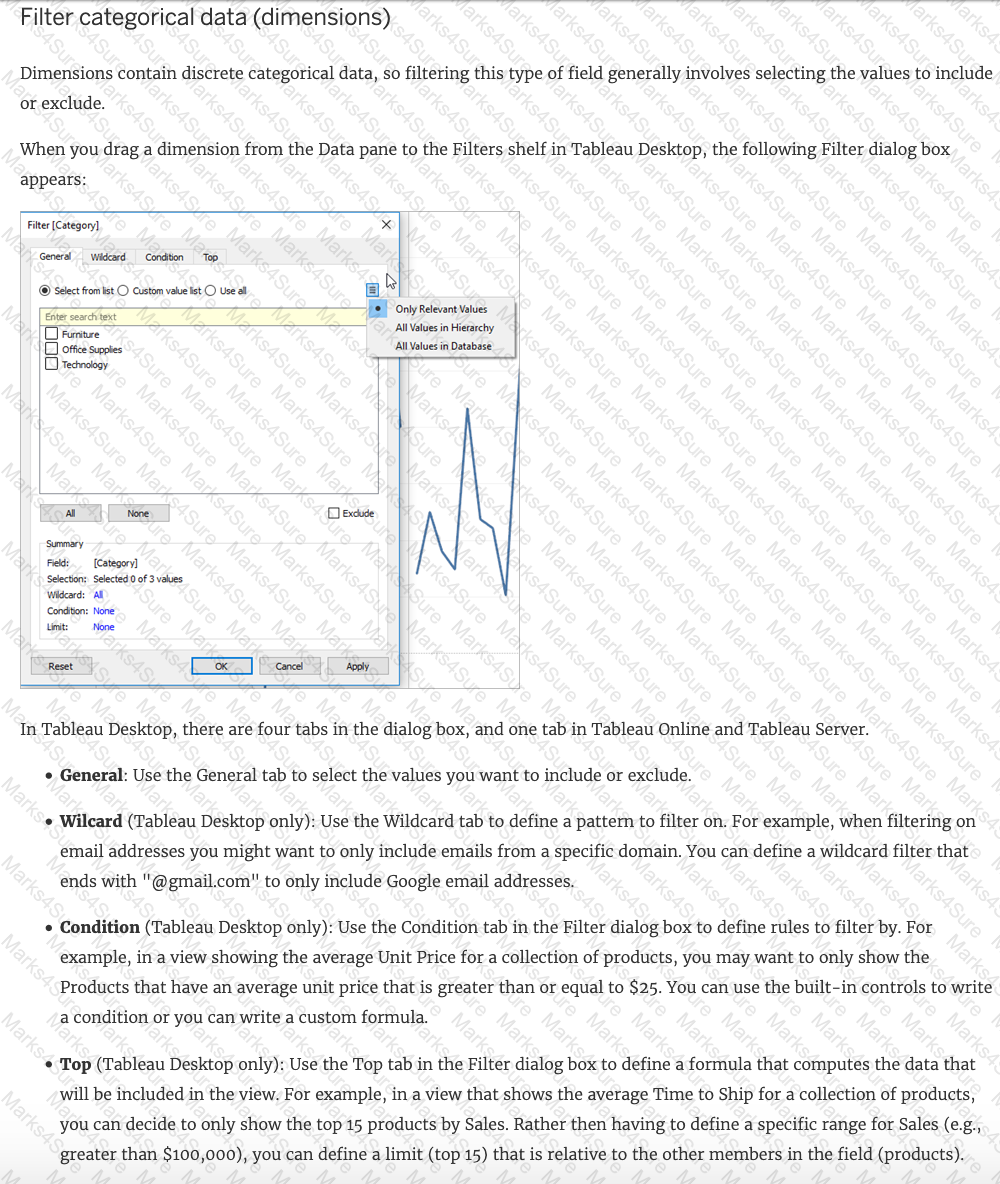
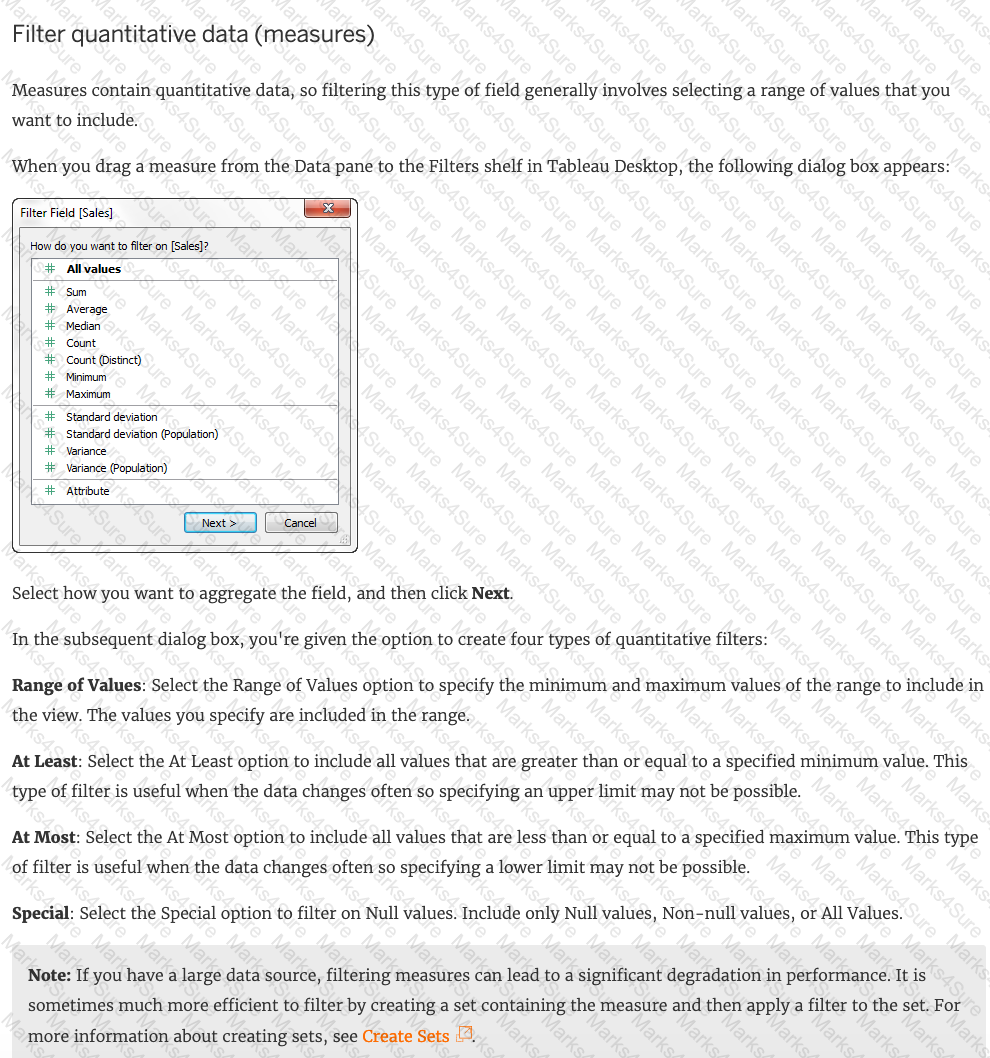
True or False: You get different filtering options for categorical and quantitative data
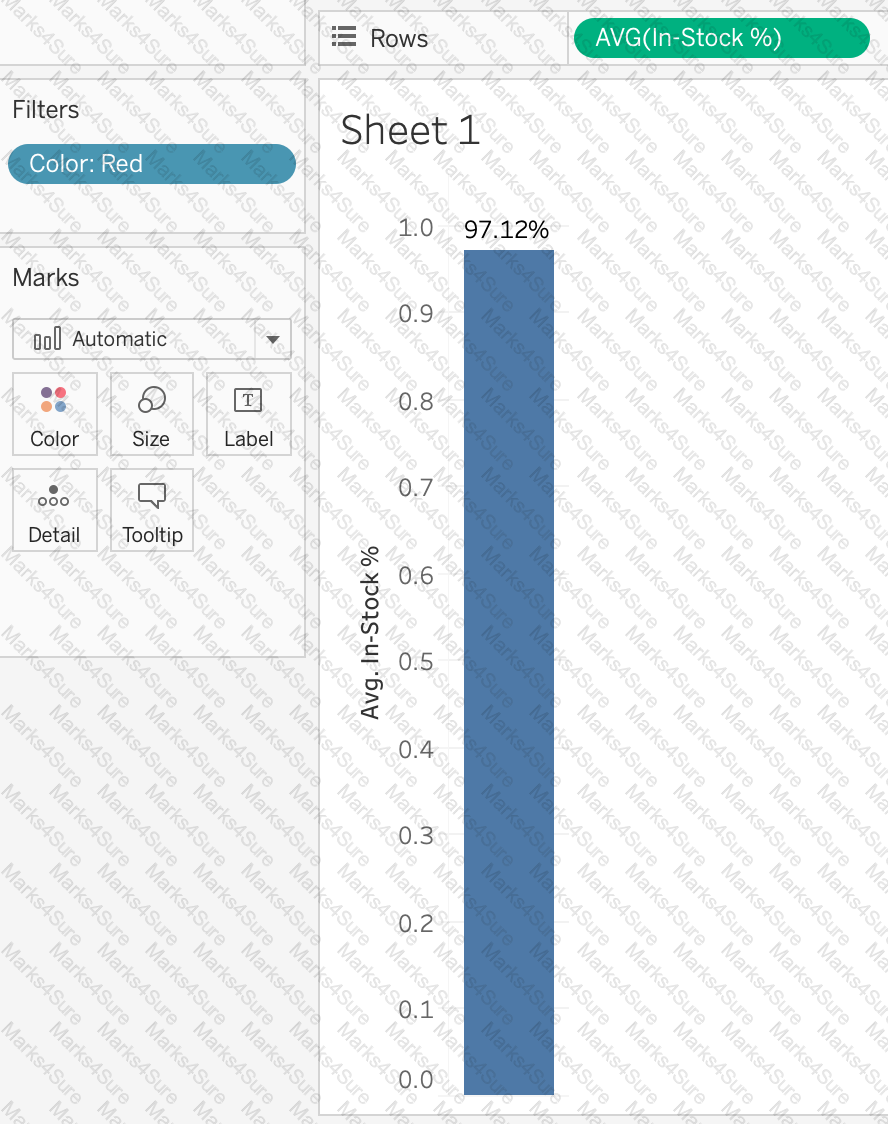
Using the Geo Data table, create a Bar chart showing the In-Stock percentage for each Color. What is the Average In-Stock percentage for the Color Red? Present your answer correctly upto 2 decimal places.
 Graphical user interface, text, application
Description automatically generated
Graphical user interface, text, application
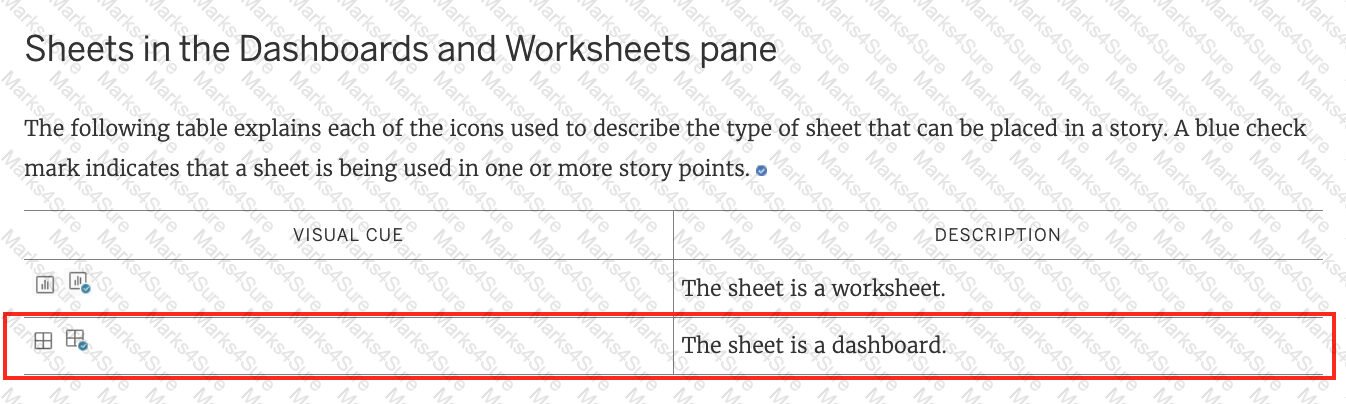
Description automatically generatedTrue or False: A sheet cannot be used within a story directly. Either sheets should be used within a dashboard, or a dashboard should be used within a story.


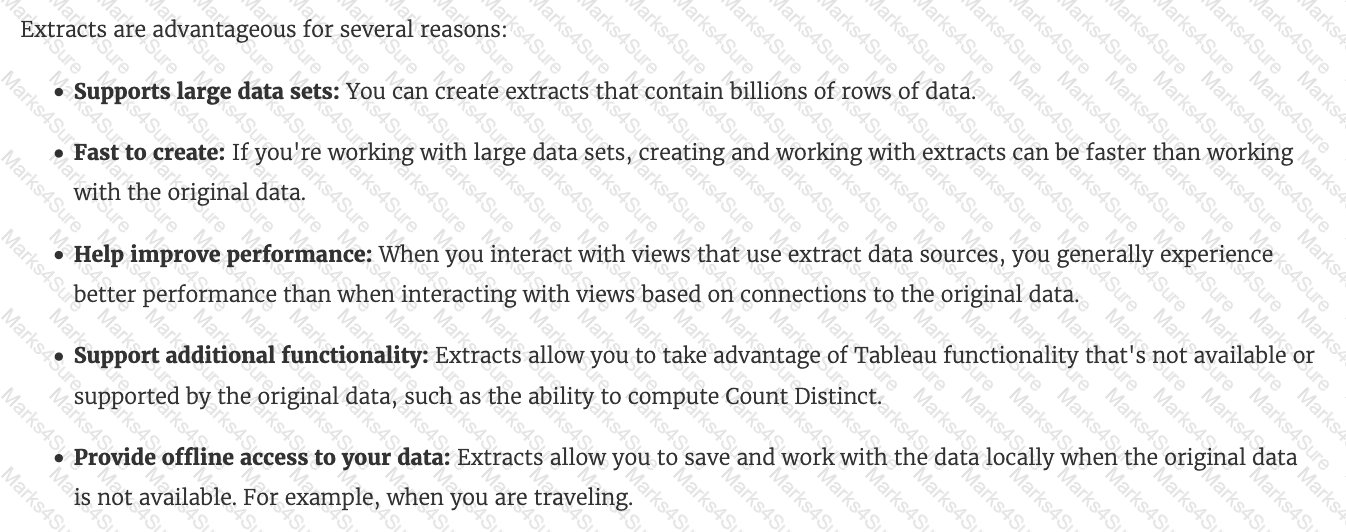
Which of the following are valid reasons to use a Tableau Data Extract (.tde) over Live Connections?
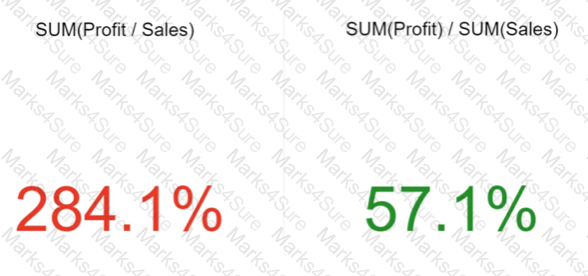
Which of the following is the correct way to calculate Profit Ratio in Tableau?
You need to create a calculation that returns a customer name followed by a comma, a space, and then the customer ' s age (for example: John Doe, 32).
What should you include in the calculation?
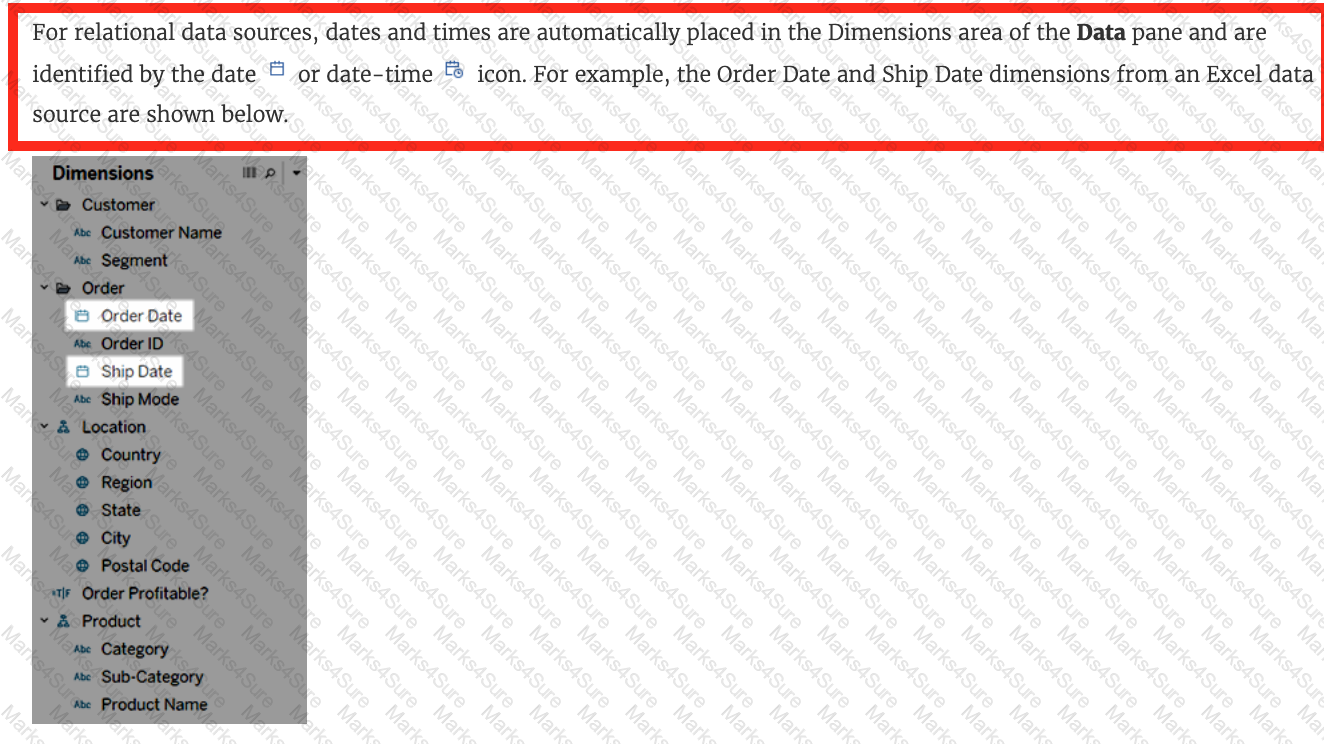
Tableau will automatically create a hierarchy for which two kinds of data? Choose two.
You need to display the complete list of potential data connections when you connect to a server. What action should you perform?
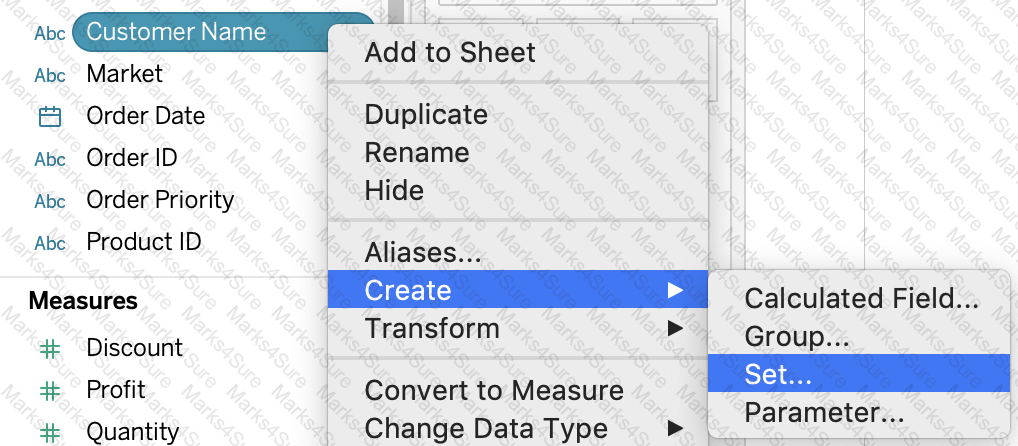
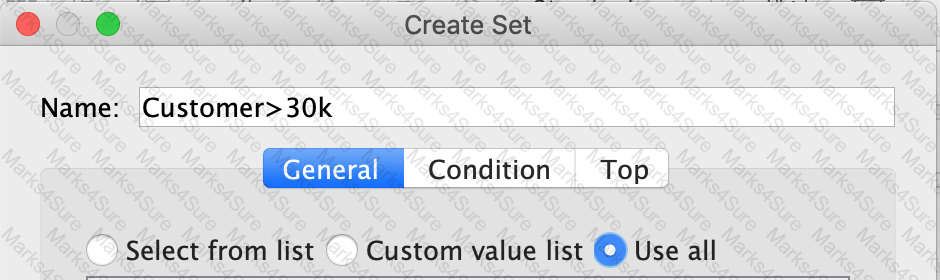
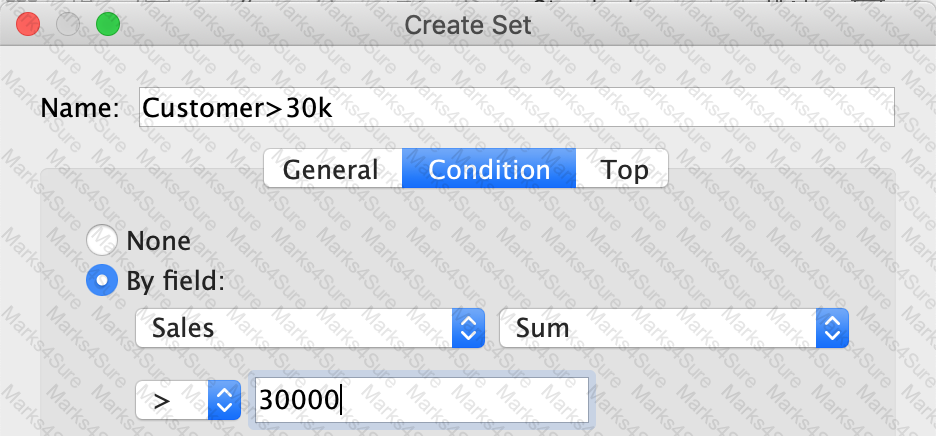
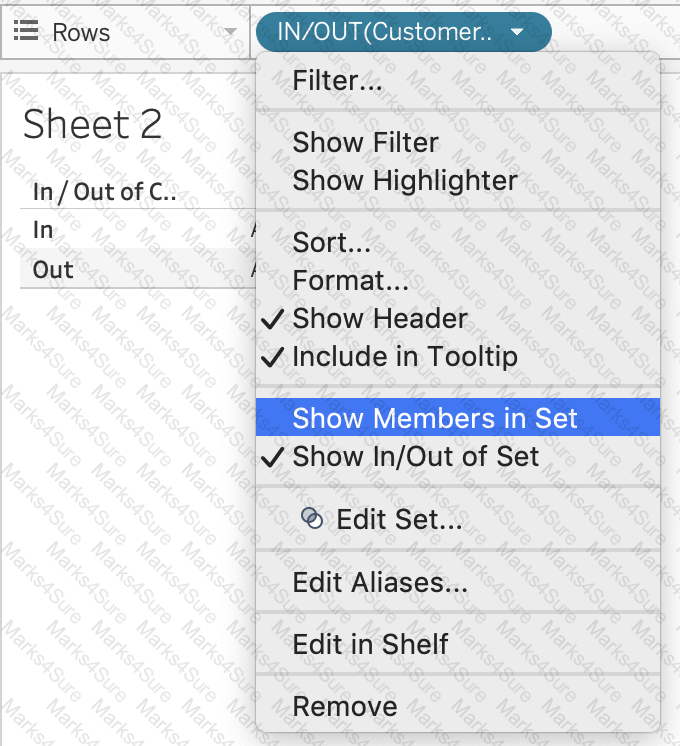
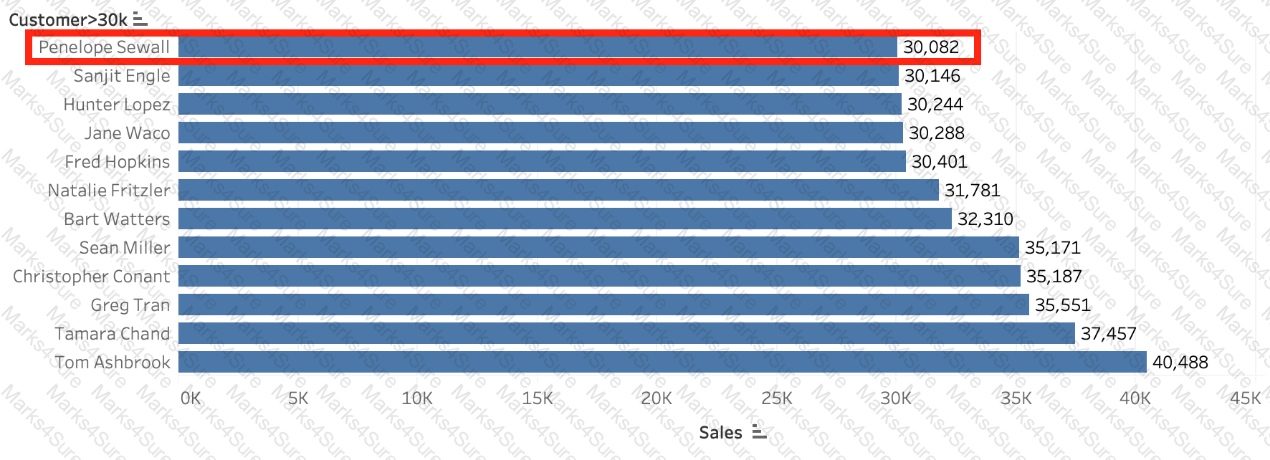
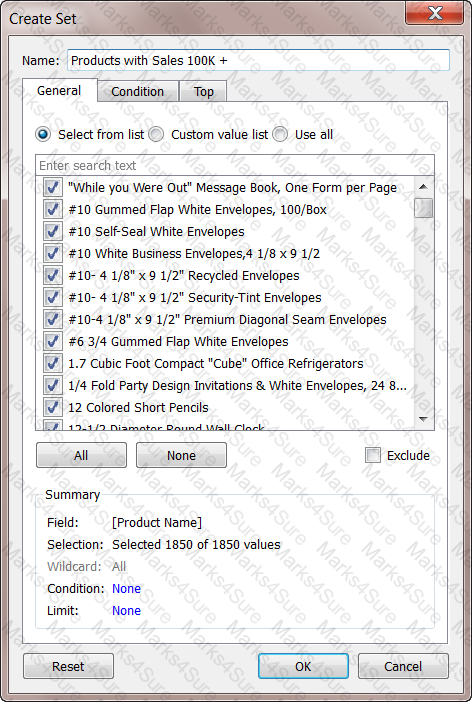
Create a Set containing Customer Names whose Sales are GREATER than 30,000. Which customer had the LEAST sales in this set?

 c
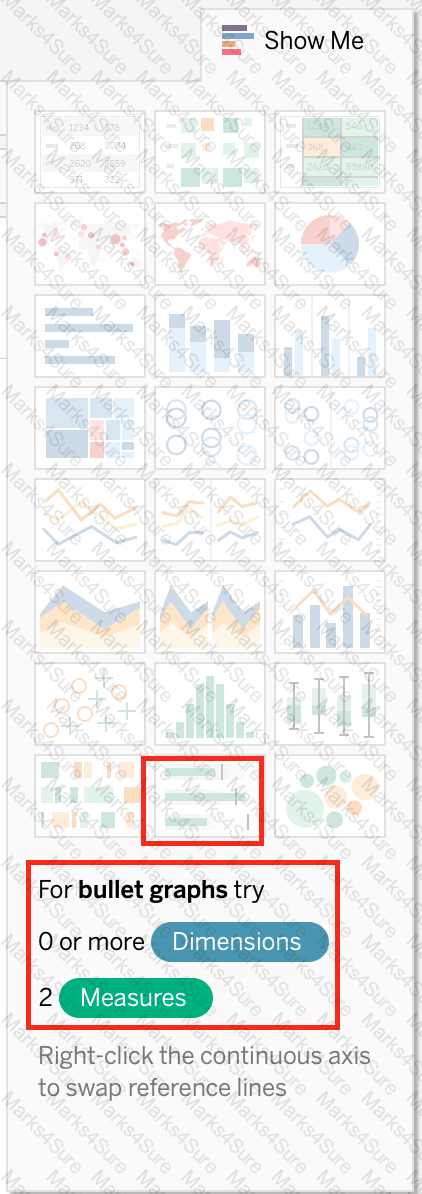
cWhich of the following represent a valid method to create a Bullet Graph with the LEAST number of fields possible?
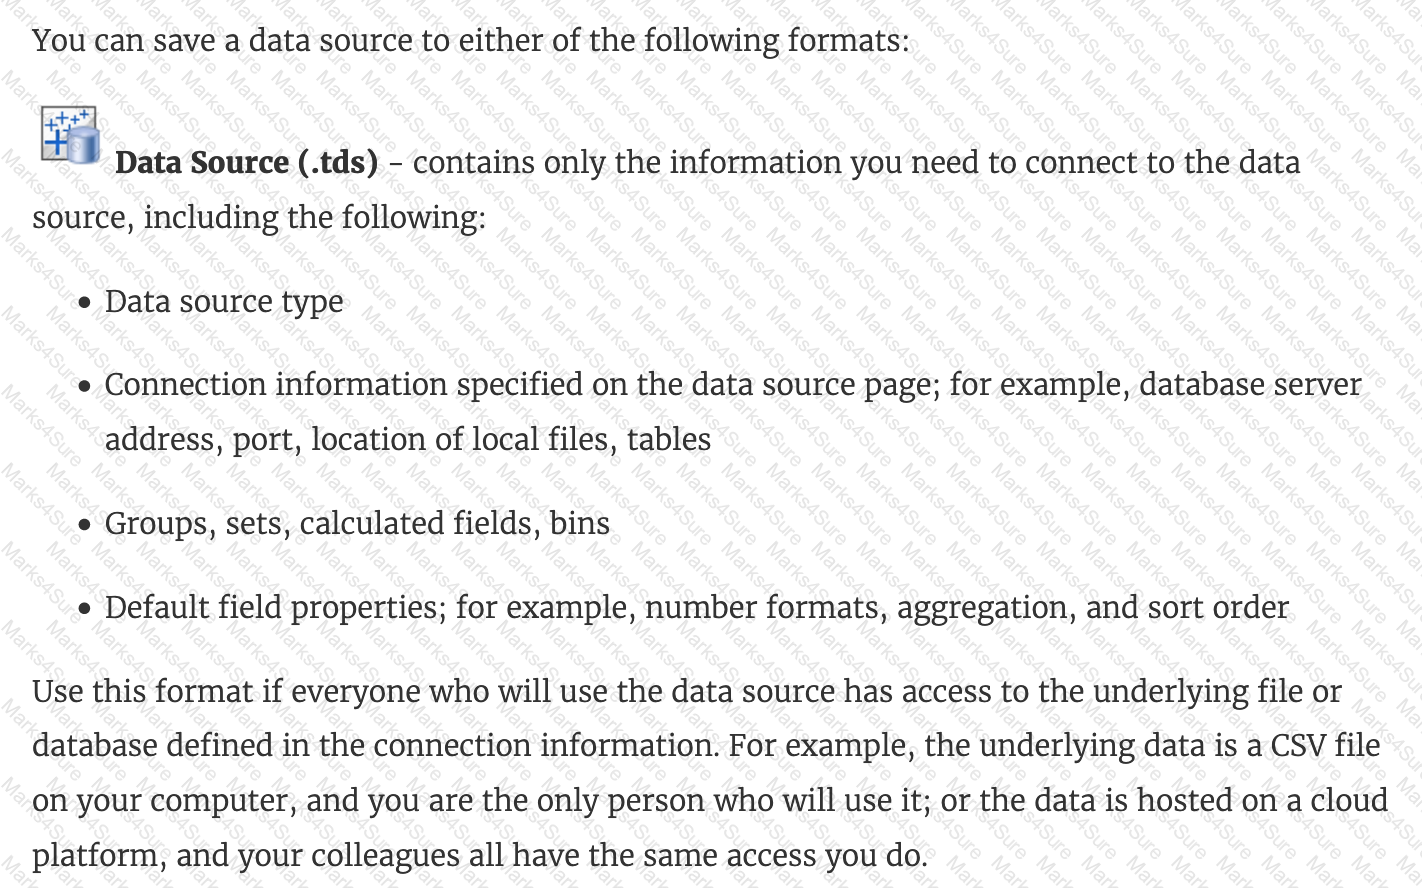
________________ files are shortcuts for quickly connecting to the original data that you use often. Data source files do not contain the actual data but rather the information necessary to connect to the actual data as well as any modifications you ' ve made on top of the actual data such as changing default properties, creating calculated fields, adding groups, and so on.
When using a data source that has relationships, how can you add a join between two or more tables?
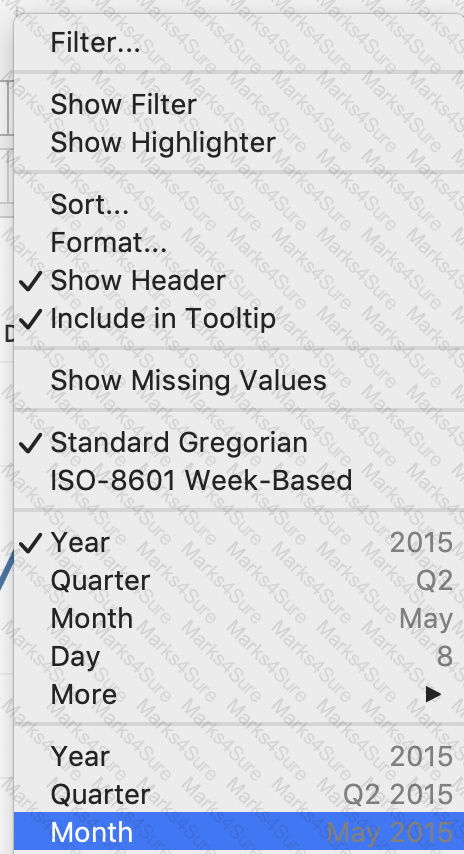
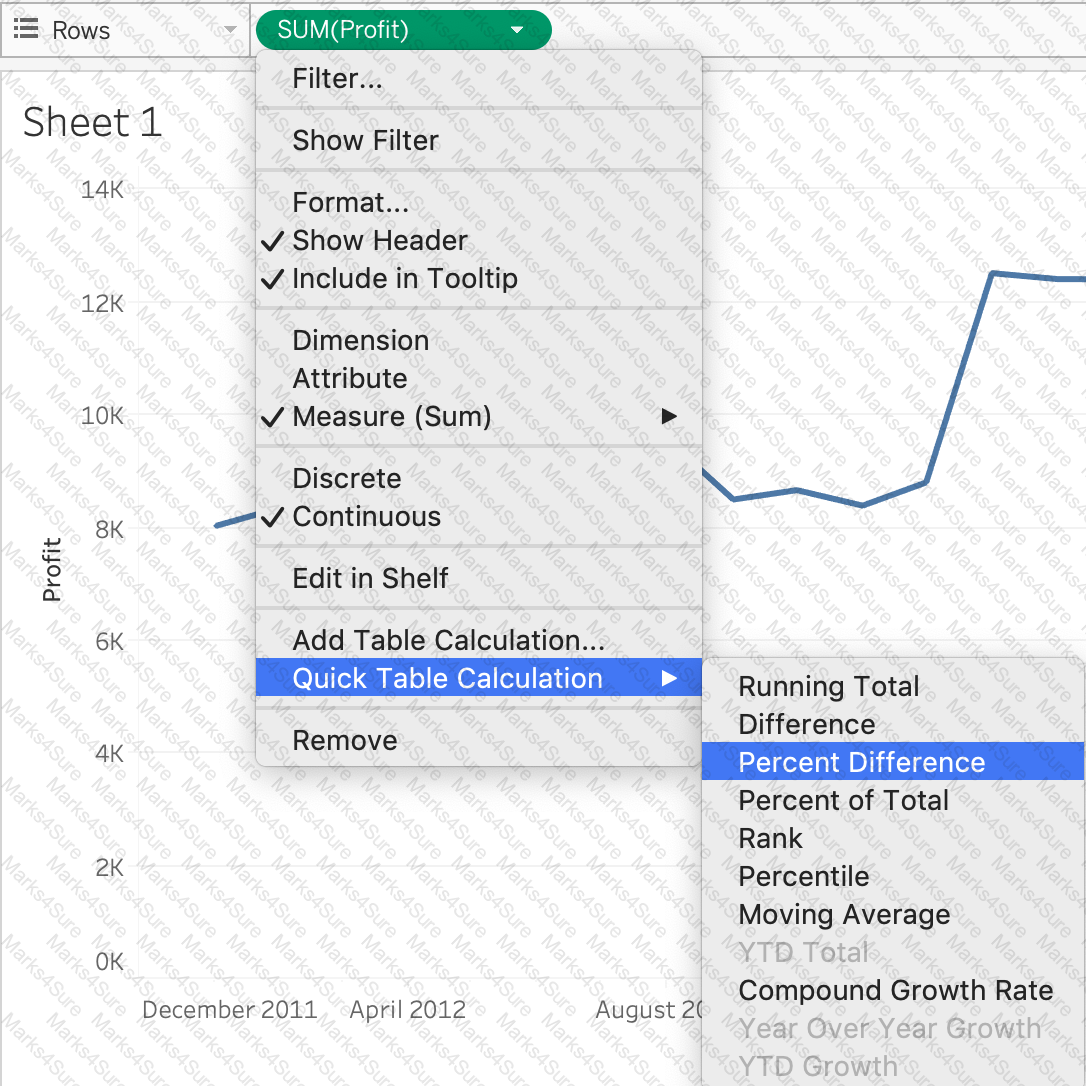
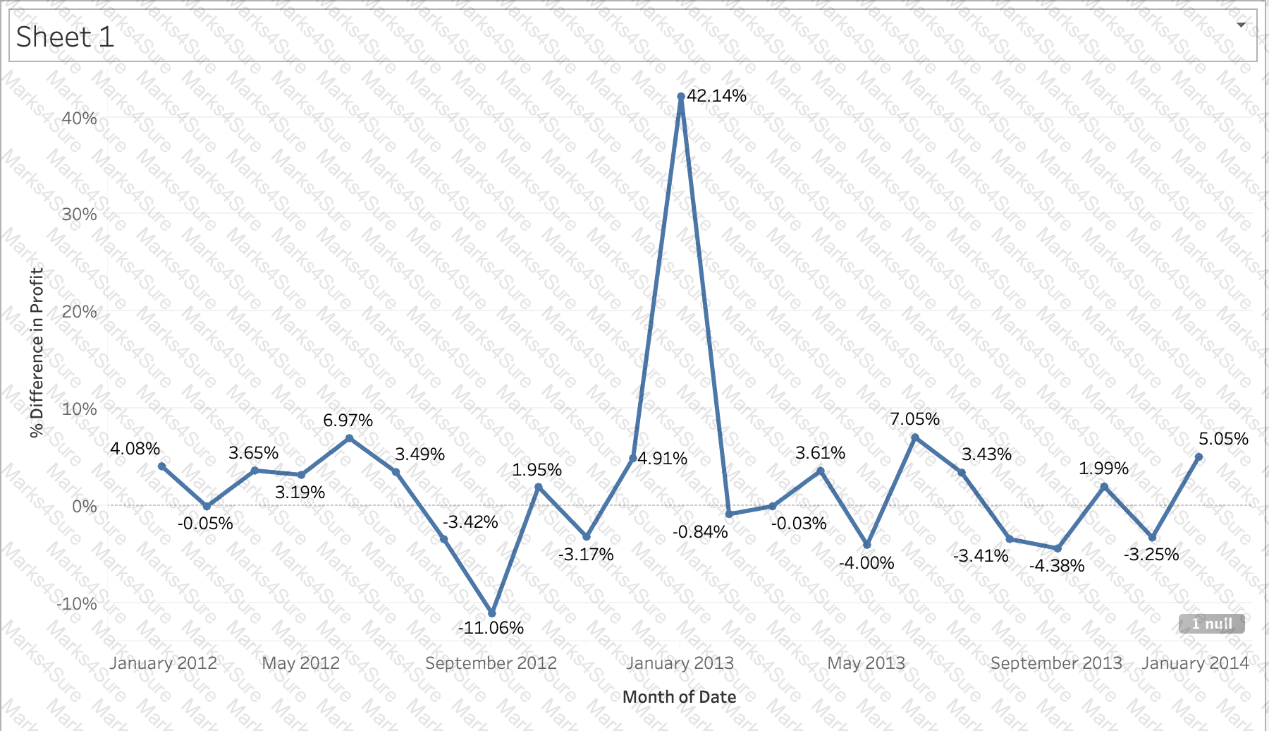
Using the CoffeeChain table, create a chart to see the monthly Percent difference change in Profit, from the beginning of 2012 to the end of 2013. How many months saw a Negative percent difference in Profit?

_____________ contains the visualisations, info needed to build the visualisations, and a copy of the data source.
Which type of date filter can you use to choose a range of dates based on TODAY ()?
What are three benefits of using an extract as compared to a live connection to a data source? Choose three.
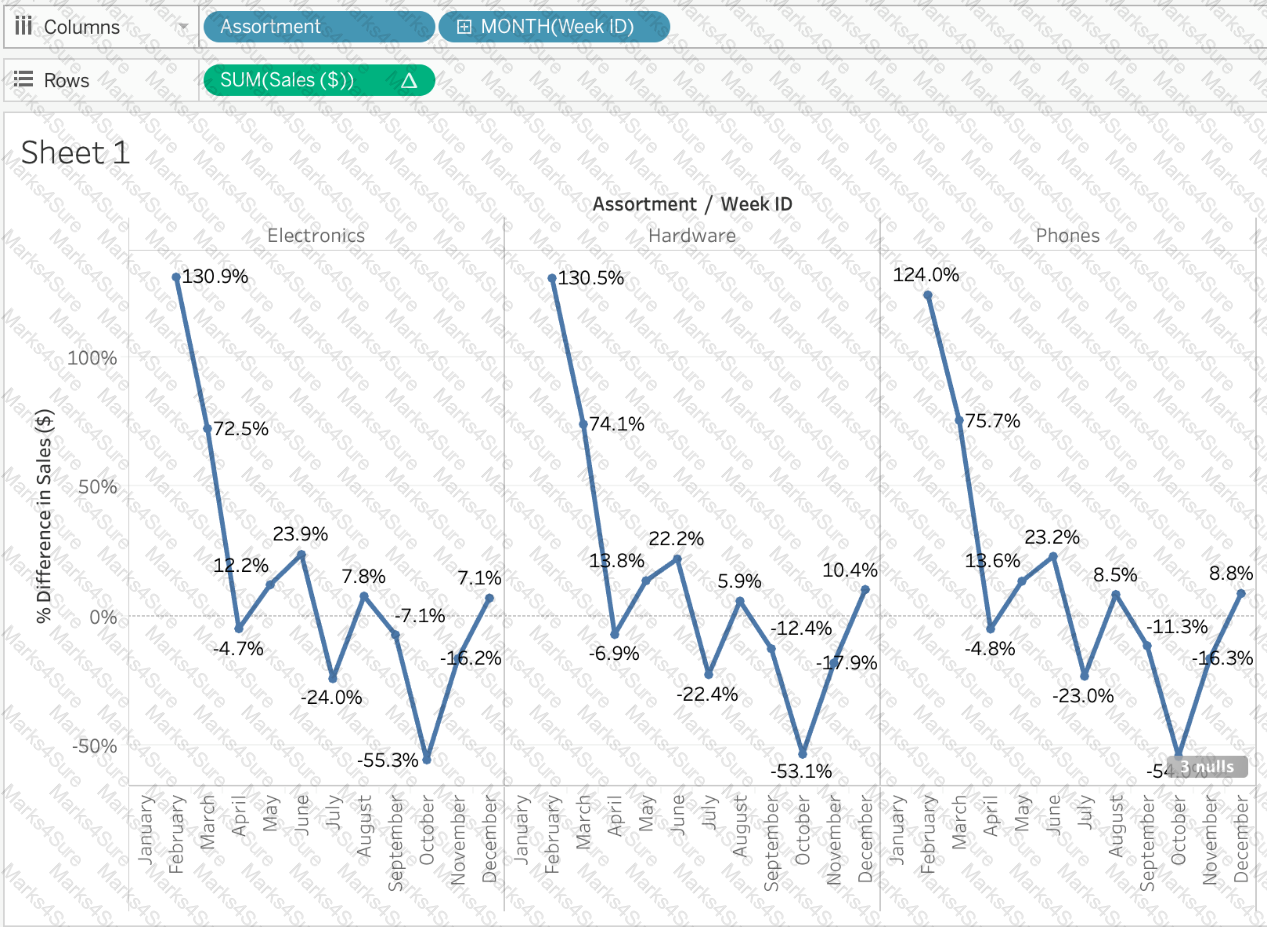
Using the Time Series Table, create a Line chart showing the Monthly Year over Year Growth for the Sales, broken down by Assortment. For the Electronics assortment, which Month had the most NEGATIVE value of Year over Year Growth?
Using the Time Series Table, create a Line chart showing the Monthly Year over Year Growth for the Sales, broken down by Assortment. For the Electronics assortment, which Month had the most NEGATIVE value of Year over Year Growth?
Which of the following are valid ways to make the font more readable in Tableau?
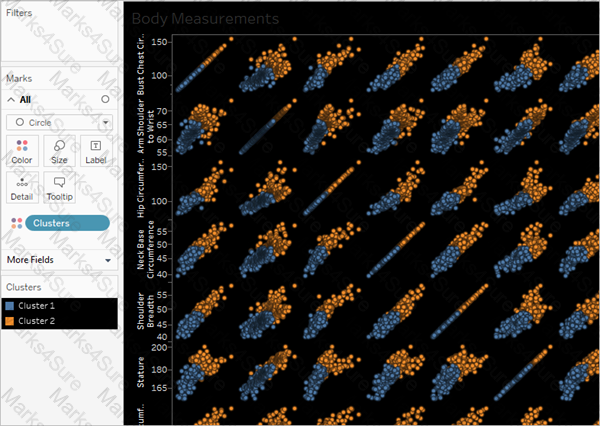
__________ is a technique in Tableau which will identify marks with similar characteristics
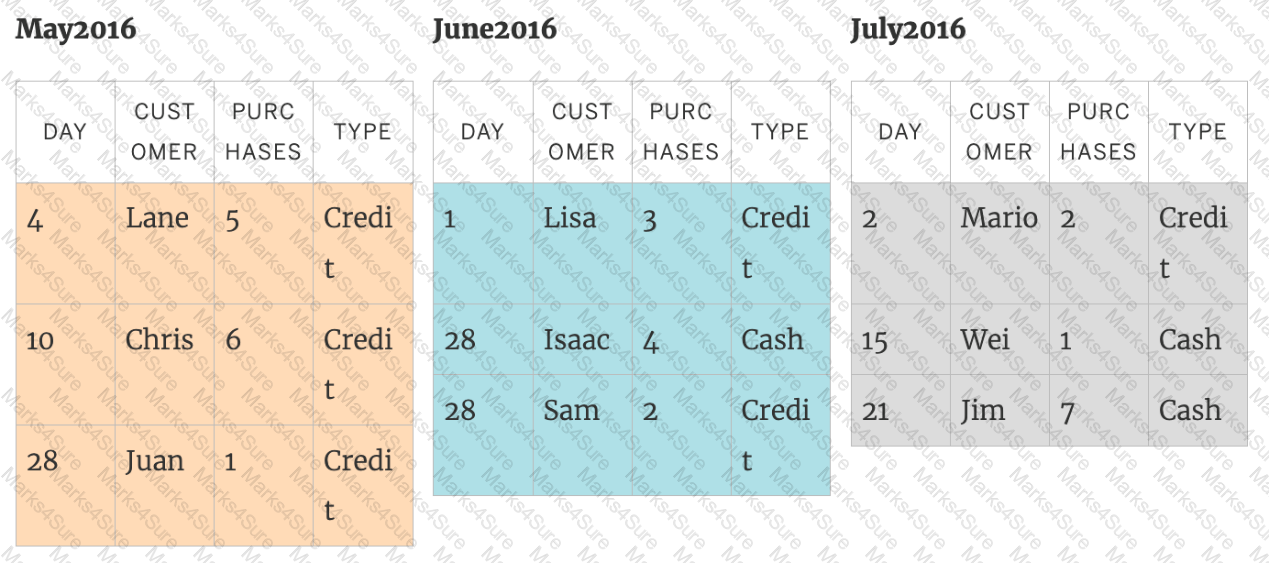
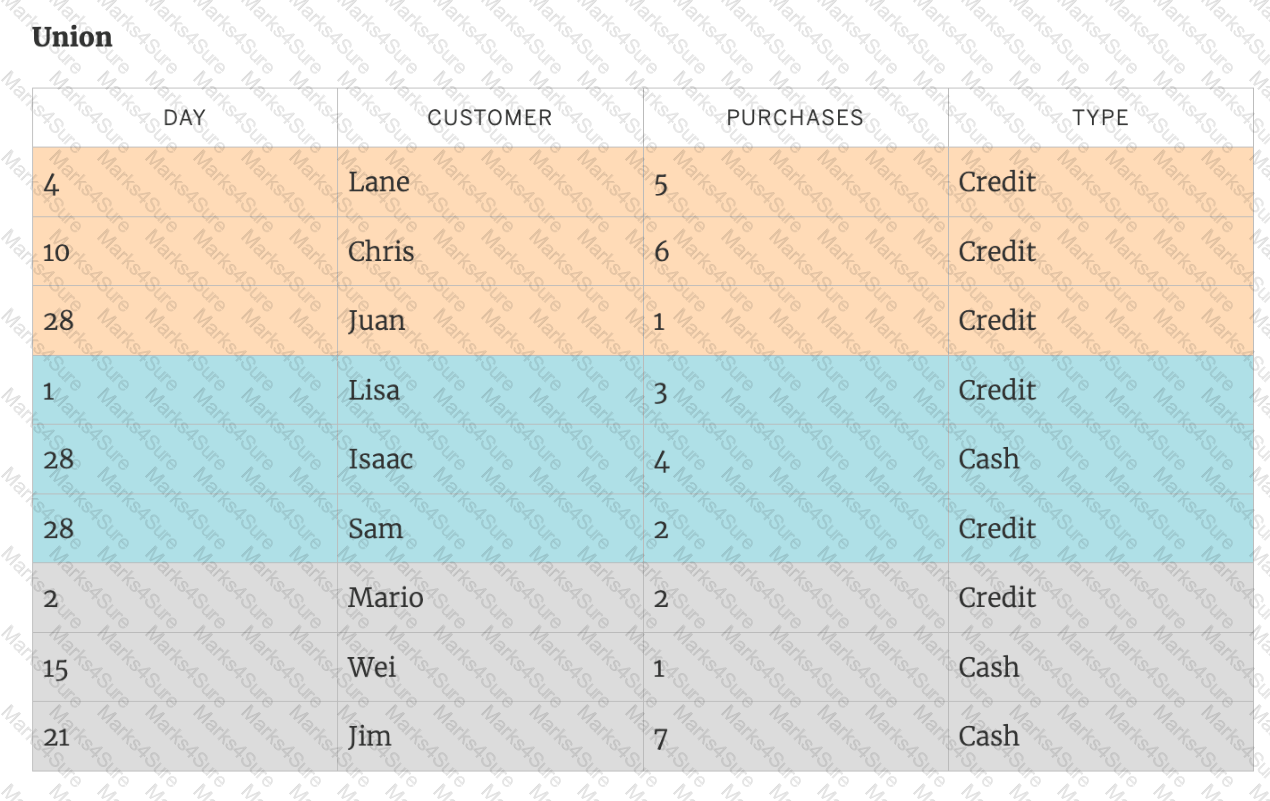
You can _______________ your data to combine two or more tables by appending values (rows) from one table to another
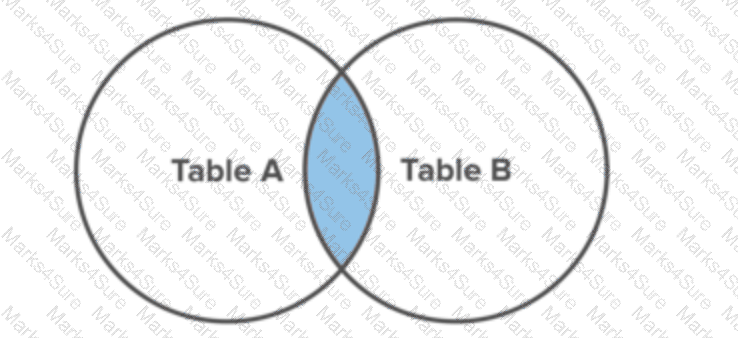
True or False: A LEFT JOIN or INNER JOIN creates a row each time the join criteria is satisfied, which can result in duplicate rows. One way to avoid this is to use data blending instead.
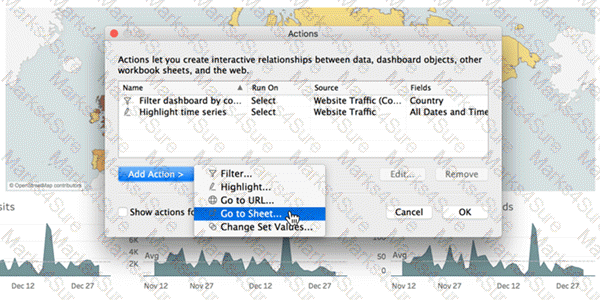
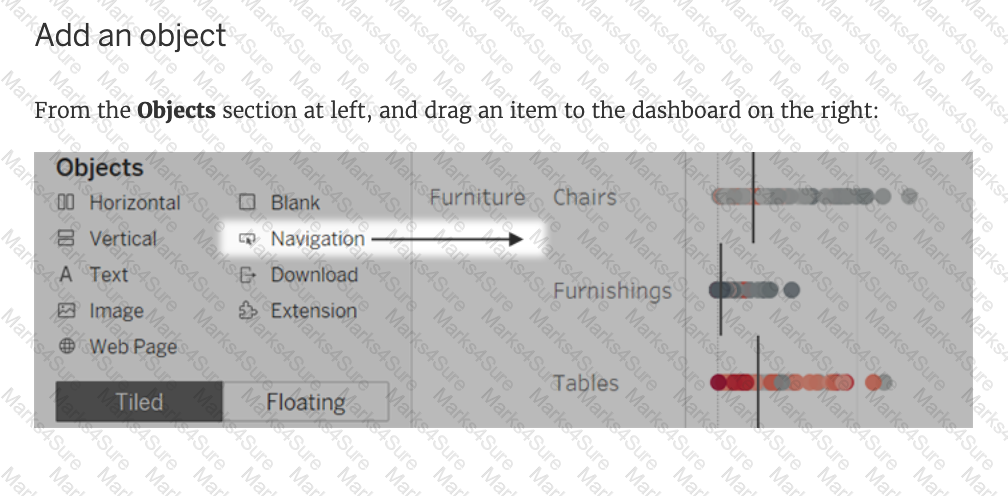
Which of the following are interactive elements that can be added to a dashboard for users?
 Graphical user interface
Description automatically generated
Graphical user interface
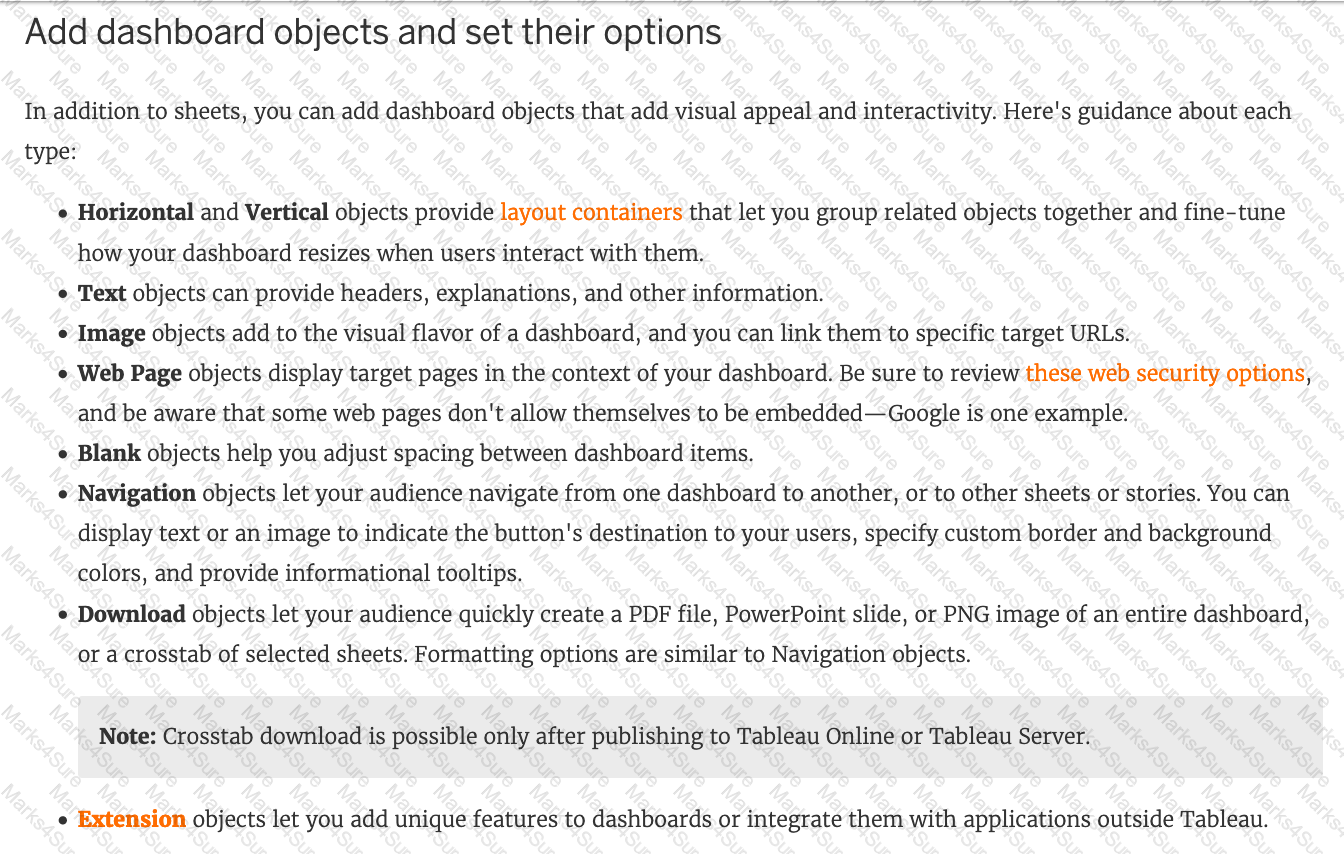
Description automatically generatedWhich of the following are valid objects when creating a dashboard in Tableau? Choose 4.

________________ can only create header. _______________ will create header and axis both.

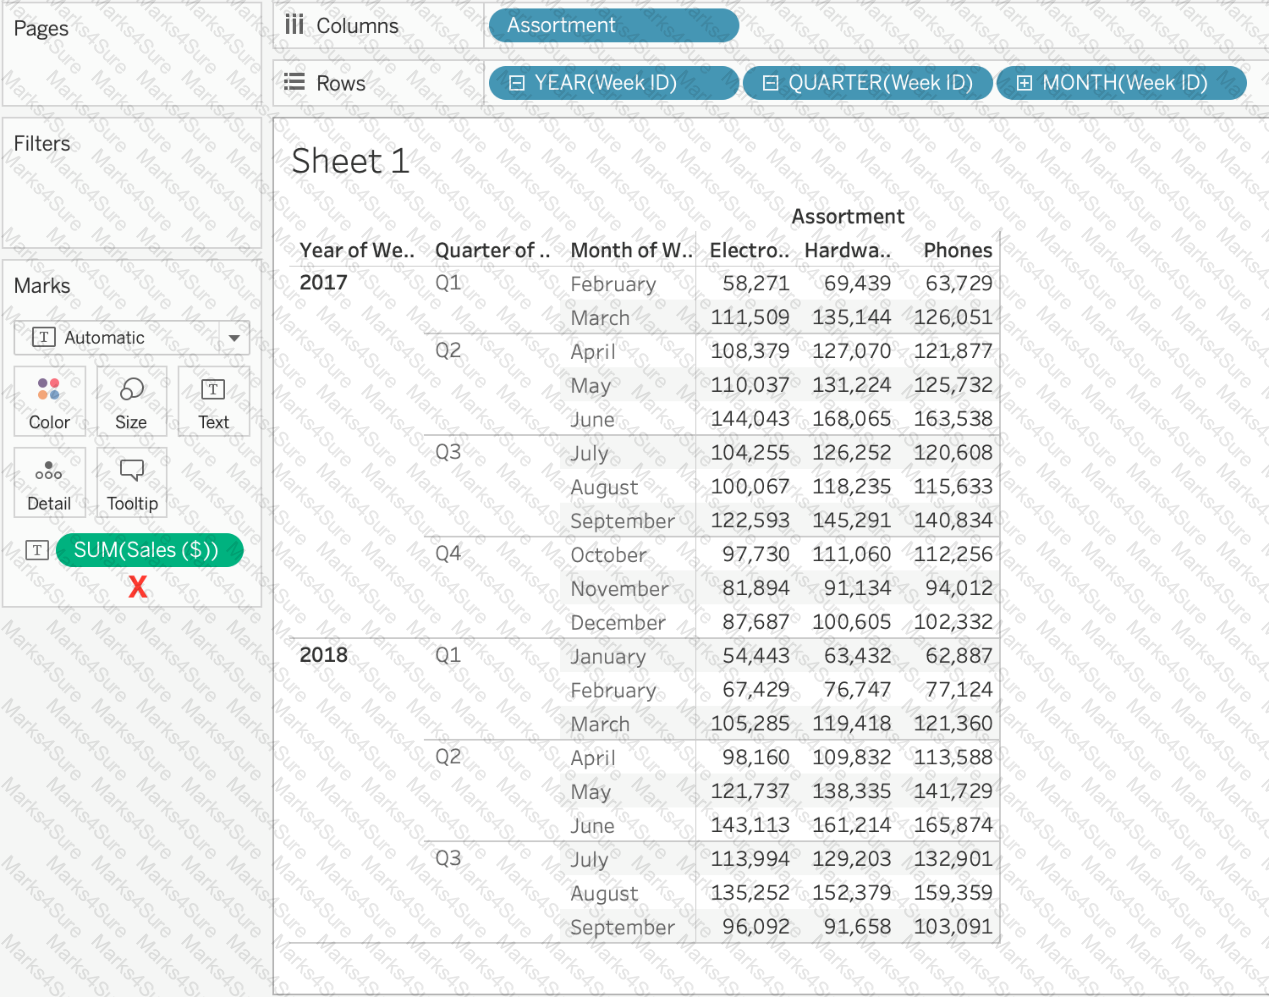
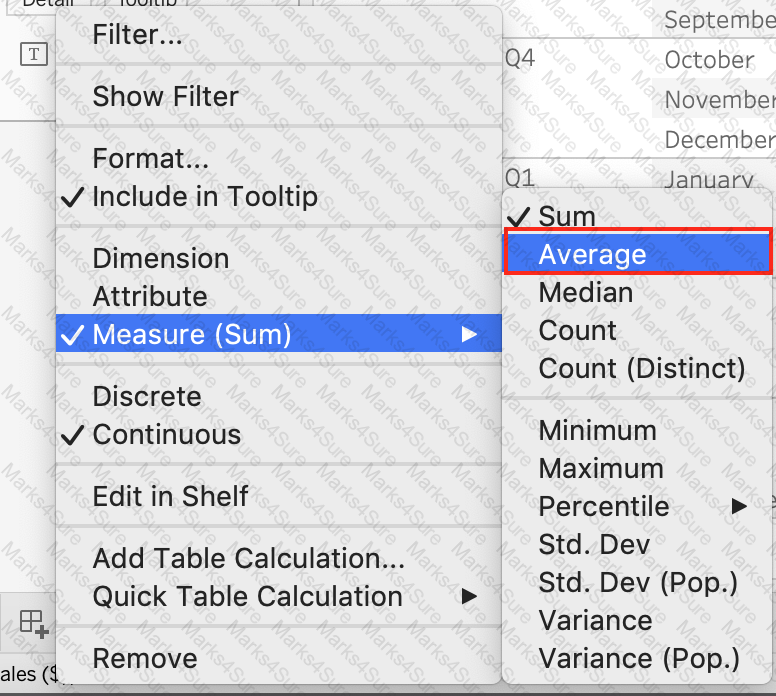
Using the Time Series table, create a cross-tab showing sales for each Assortment broken down by Year and Quarter. In Q4 of October 2017, what was the Average sales amount for the Hardware assortment?
True or False: Enabling any other type of sort (Field, alphabetic, or Nested) clears the manual sort we create.
When exporting a worksheet as an image in Tableau, which of the following file formats are available?

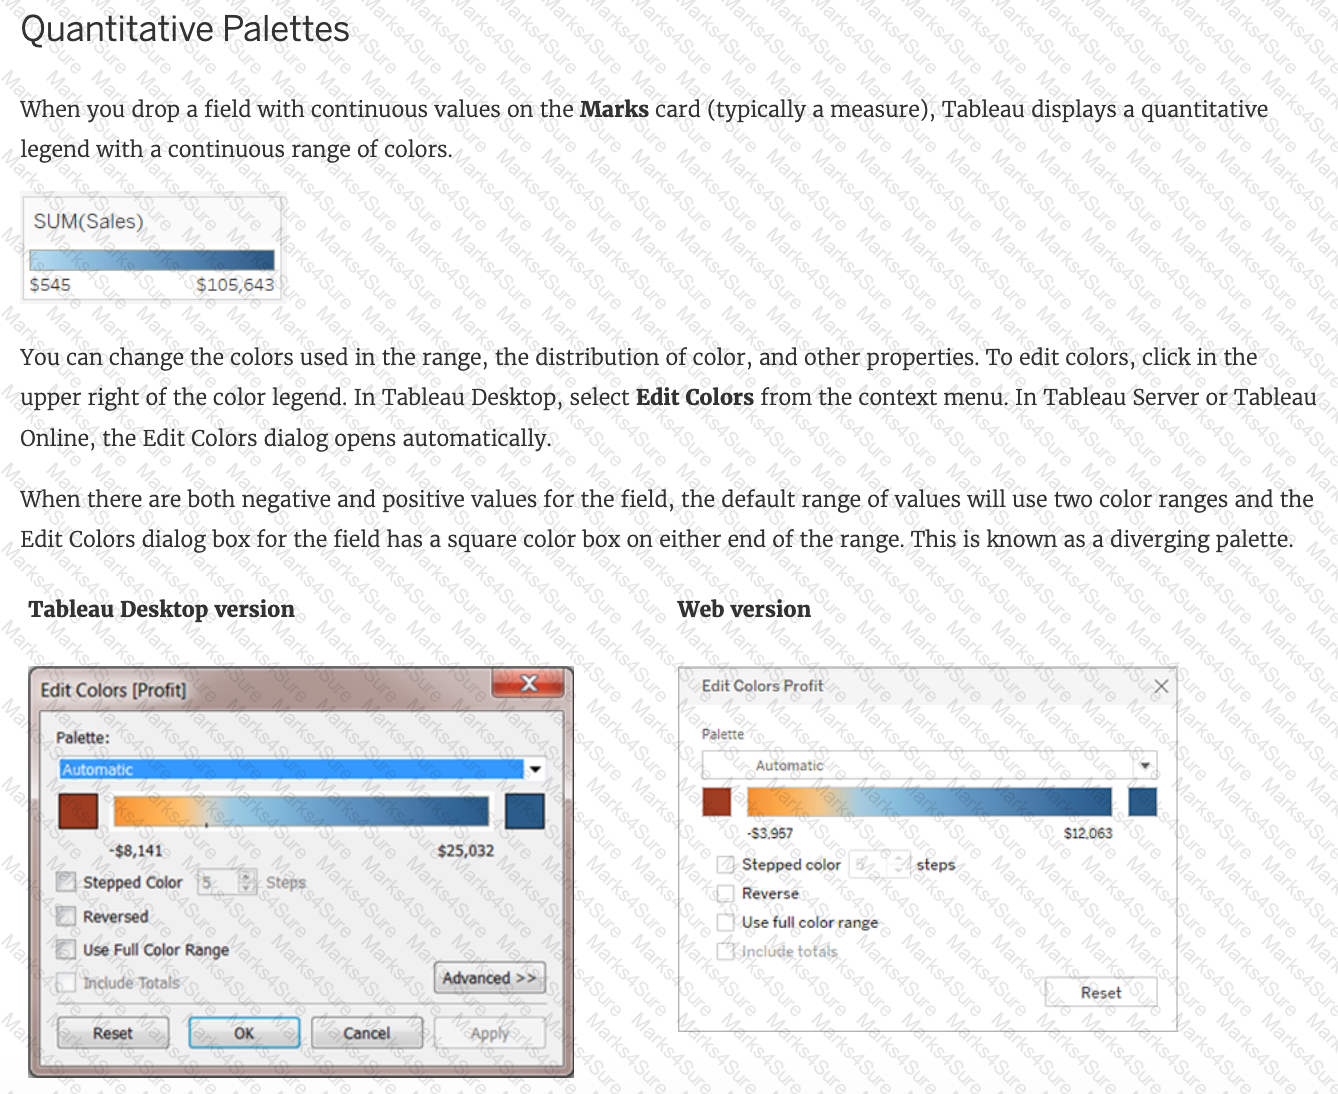
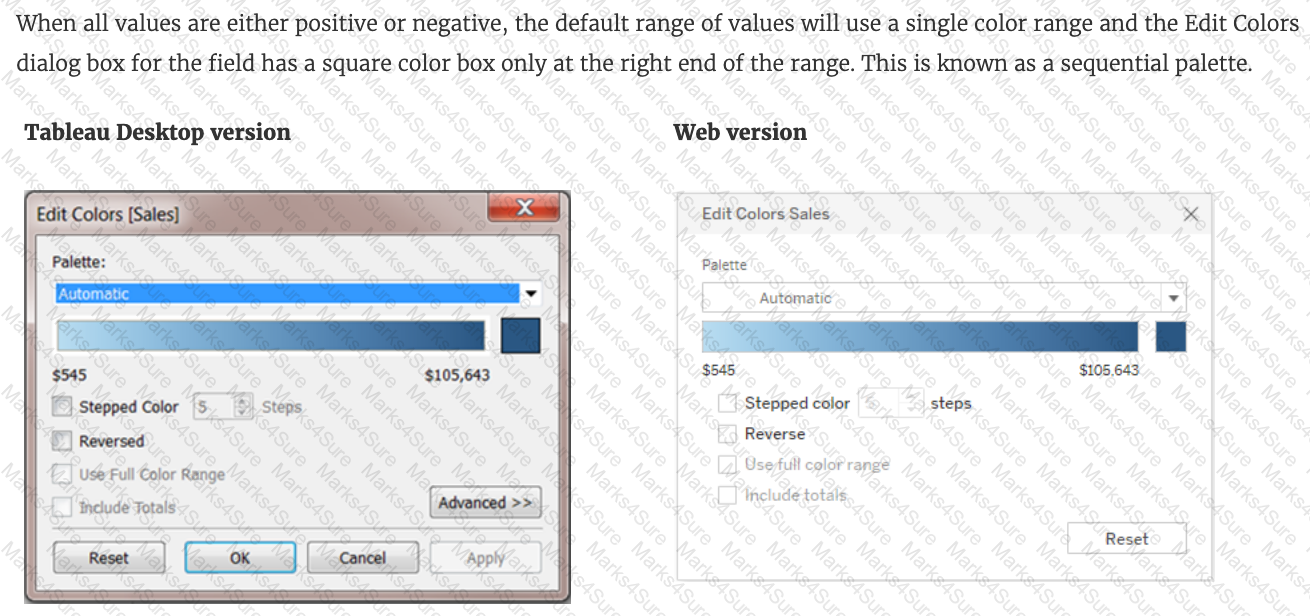
To display data that has both negative and positive quantitative values, Tableau Desktop will display marks by using__________________as the default.
Using the Time Series Table, create a Line chart showing the Monthly Year over Year Growth for the Sales, broken down by Assortment. For the Electronics assortment, which Month had the most NEGATIVE value of Year over Year Growth?
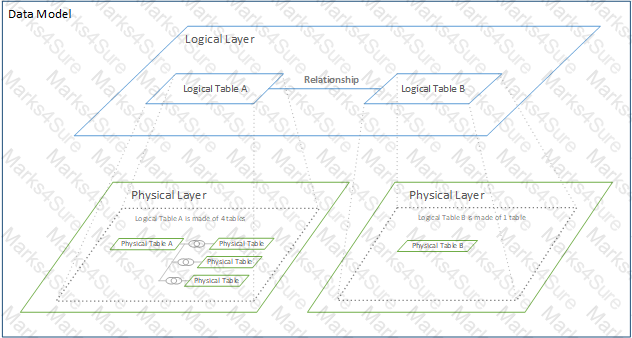
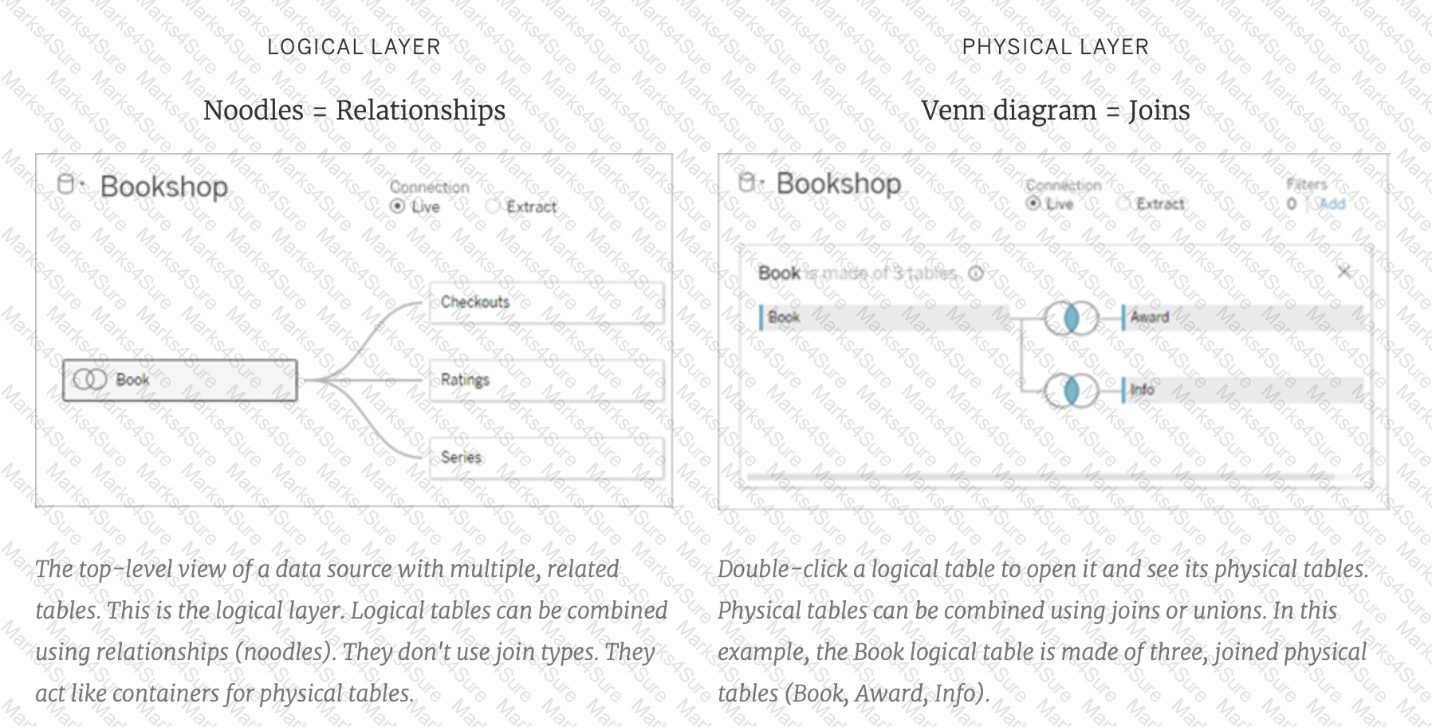
Relationships are represented by __________________ and operate at the ____________________.
Question 30: Skipped
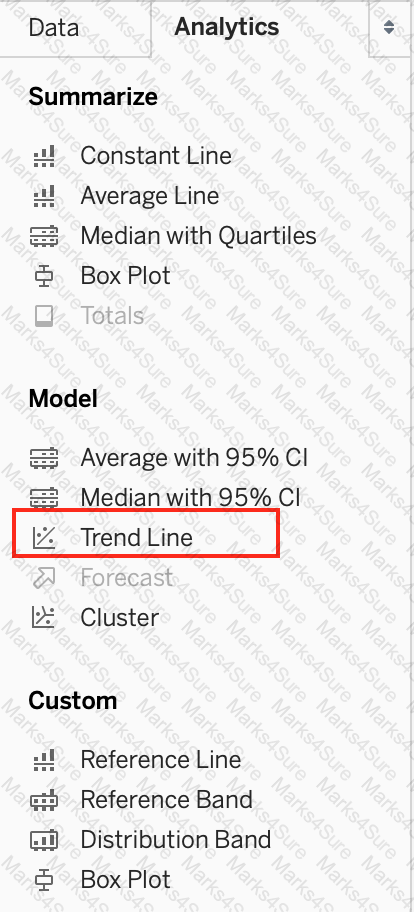
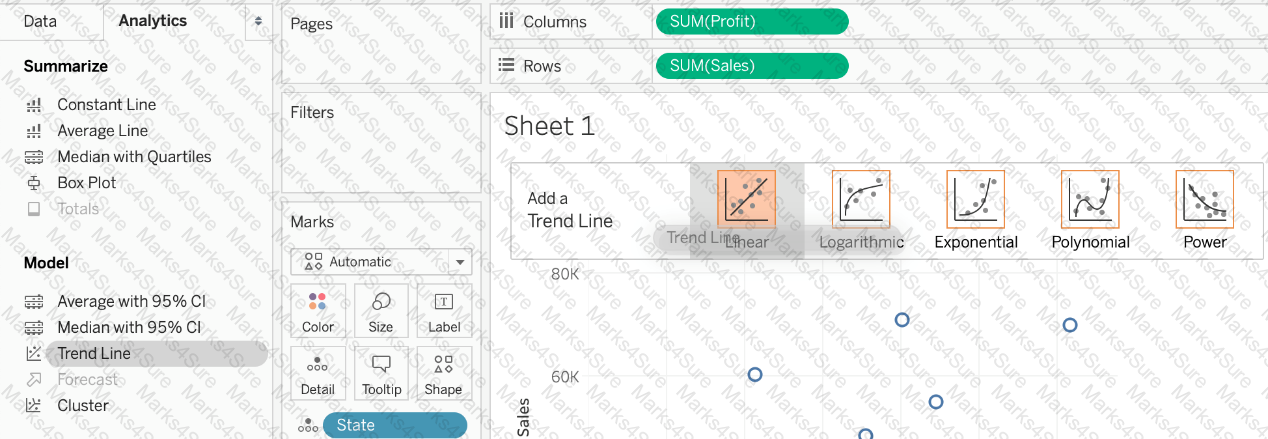
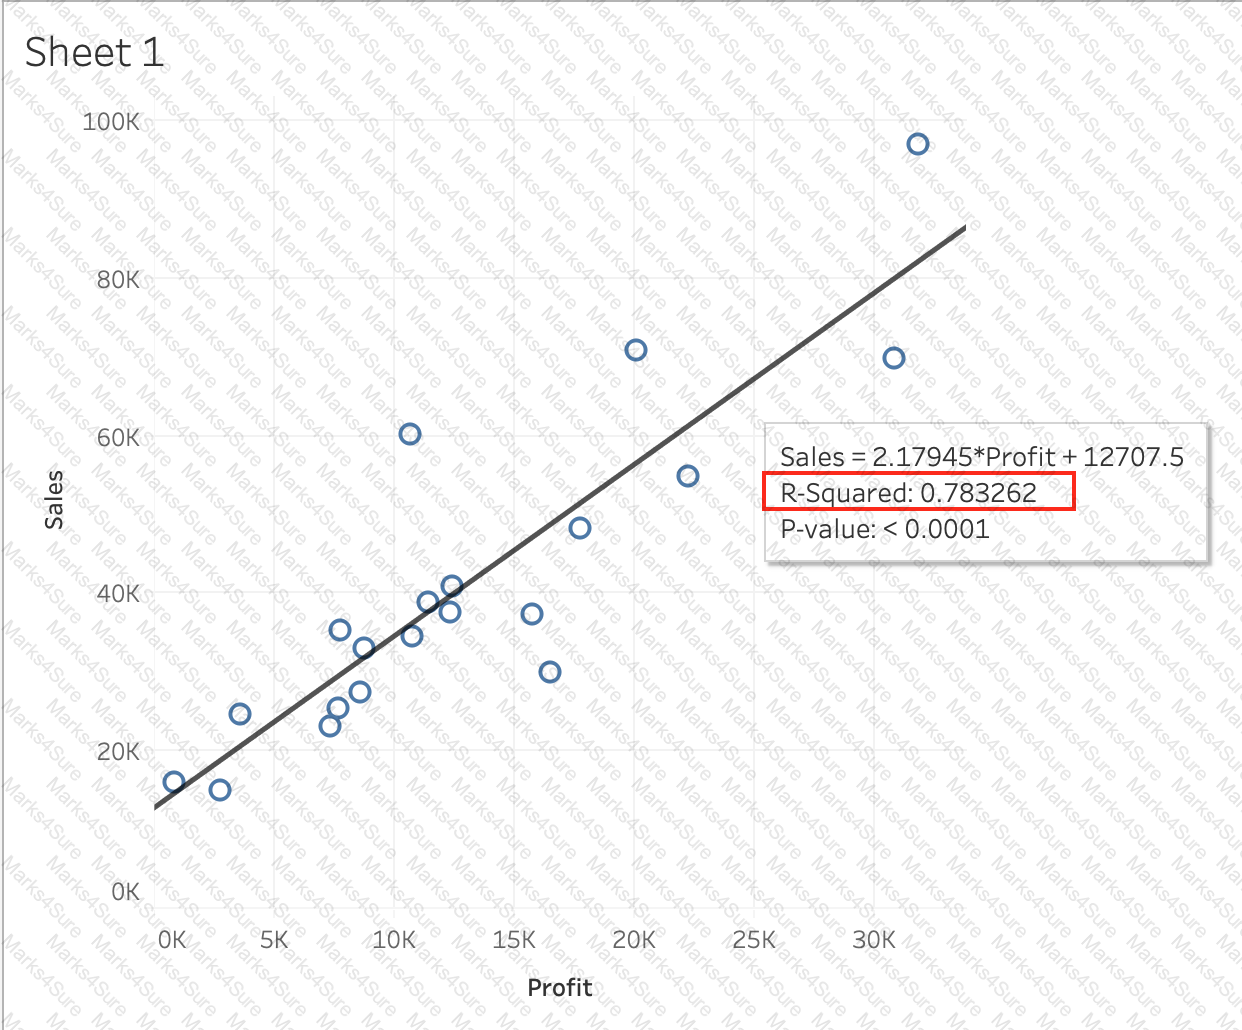
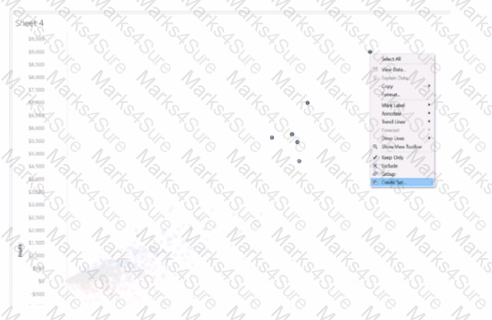
Using the CoffeeChain table, create a scatter plot of Profit (x-axis) vs Sales (y-axis) broken down by State. Add a Linear trend line to the view. What is its R-squared value?
 c
c
When creating an extract, what are three options for specifying how much data to extract? Choose three.
Given a map, which of the following fields can be placed in Size,Shape,Detail,Color
In an extract, what are three differences between a full refresh versus an incremental refresh? Choose three.
You view the relationship canvas shown in the following exhibit.
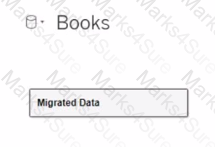
What does Migrated Data indicate?
True or False: When relating tables, the fields that define the relationships must have the same data type.
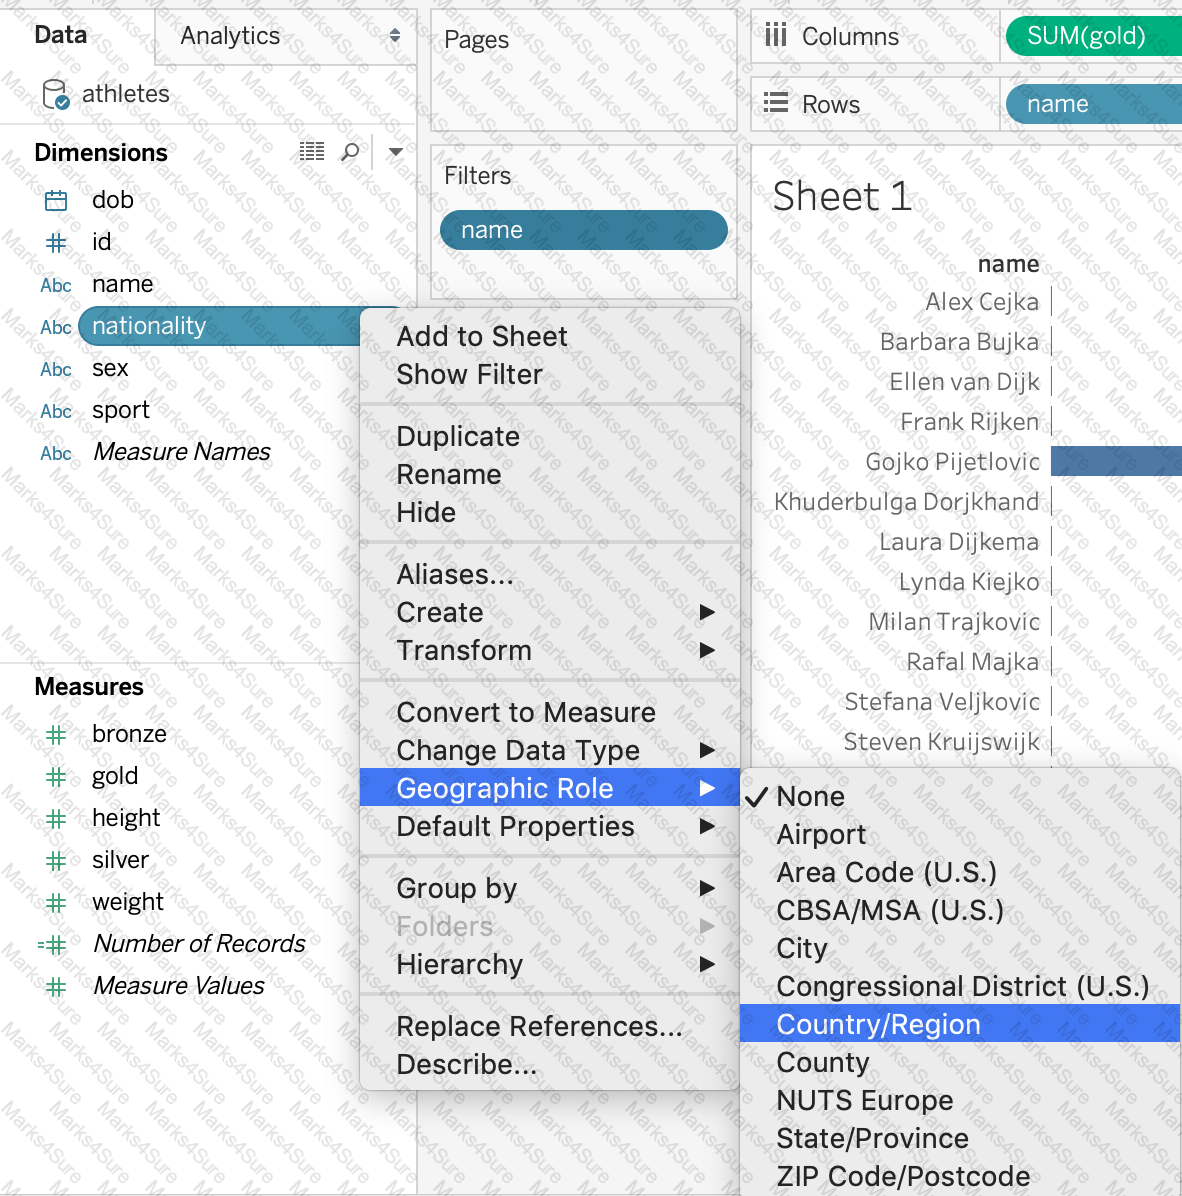
How can you MANUALLY assign geographic roles to a dimension from the data pane?

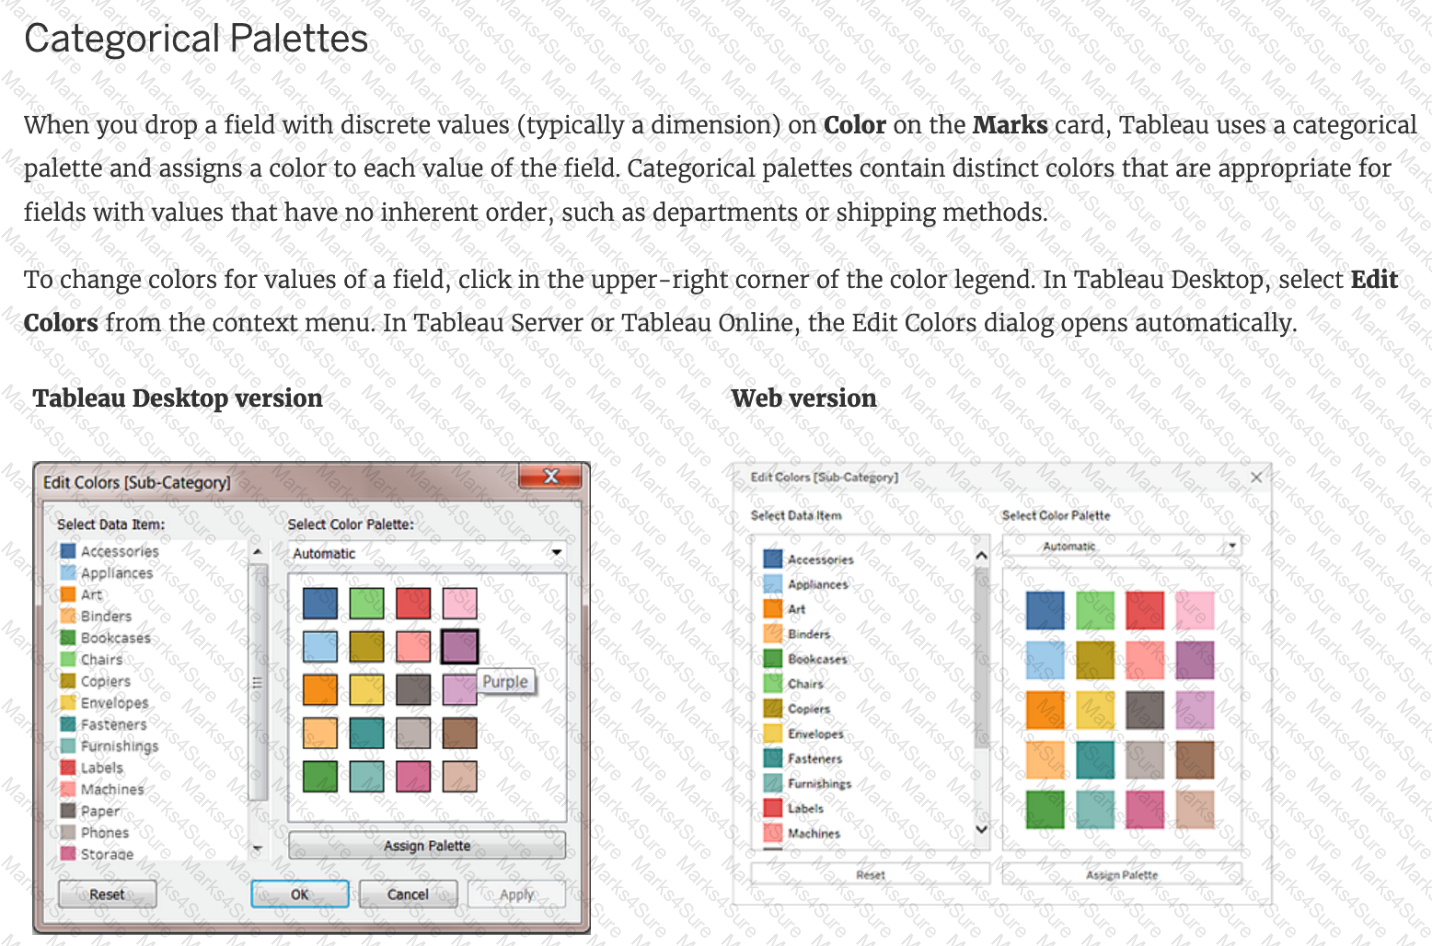
You need to access options to change a dimension ' s color palette.
In addition to the Marks card, what else can you use?
What are three ways to access bolding options for the text in a tooltip? Choose three.
Beginning in version 10.5, when you create a new extract, it uses the _________ format instead of the .tde format.
You have the following visualization.
Which set type is created when you select the Create Set option?
A field that shows average home values for the United States in 2016 is most likely :
To customize links based on the data in your dashboard, you can automatically enter field values as _______________ in URLs
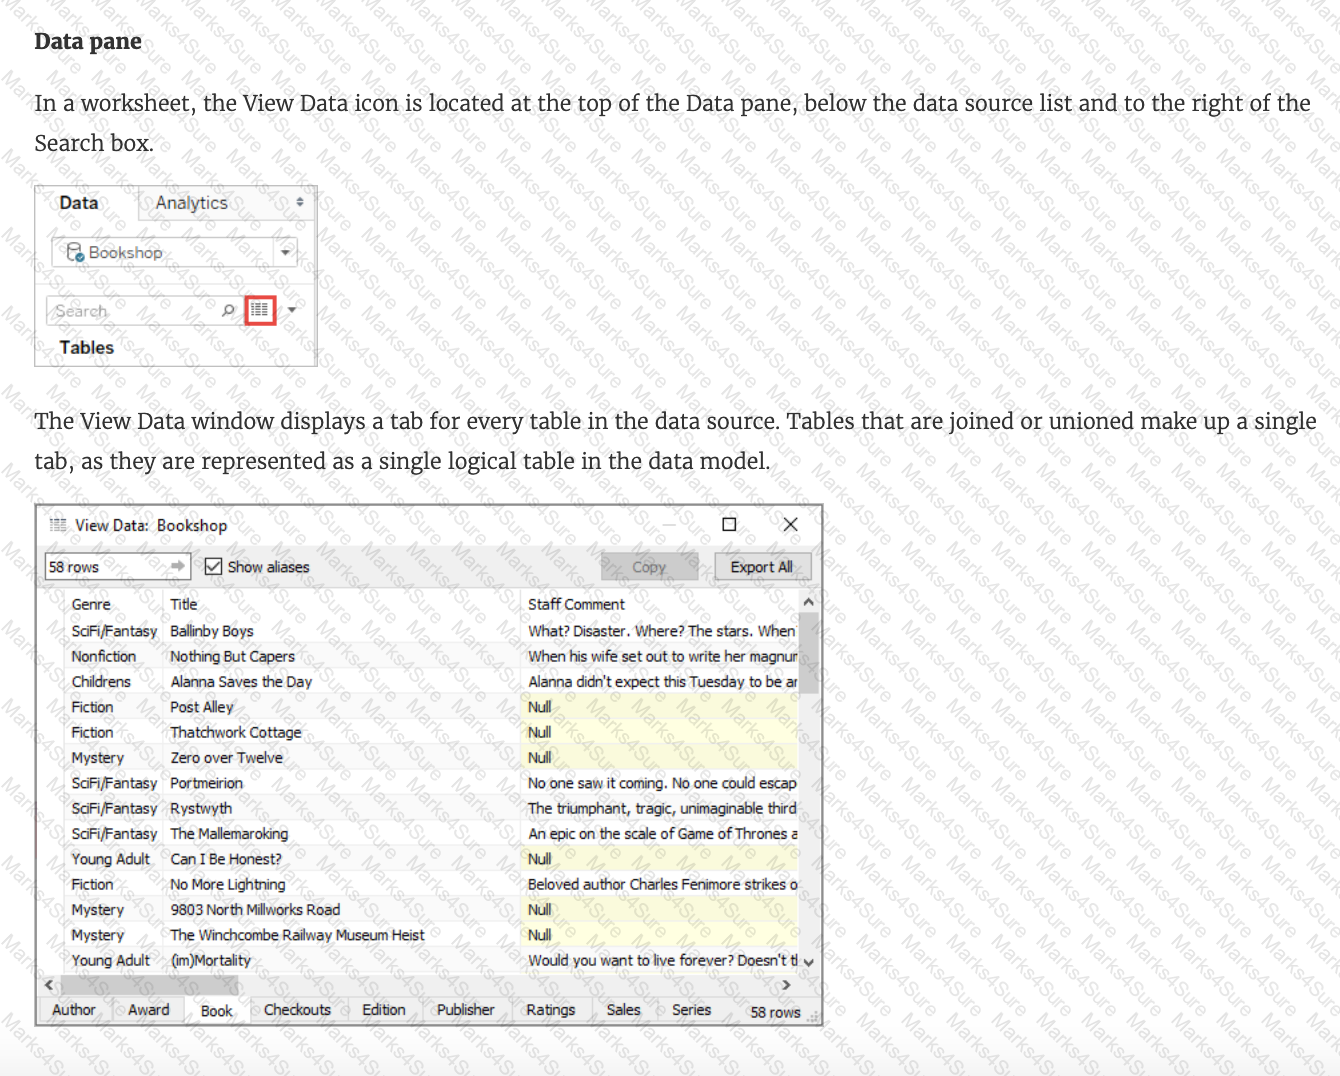
The View Data window displays as much of the data as possible by default, up to _______________ rows.
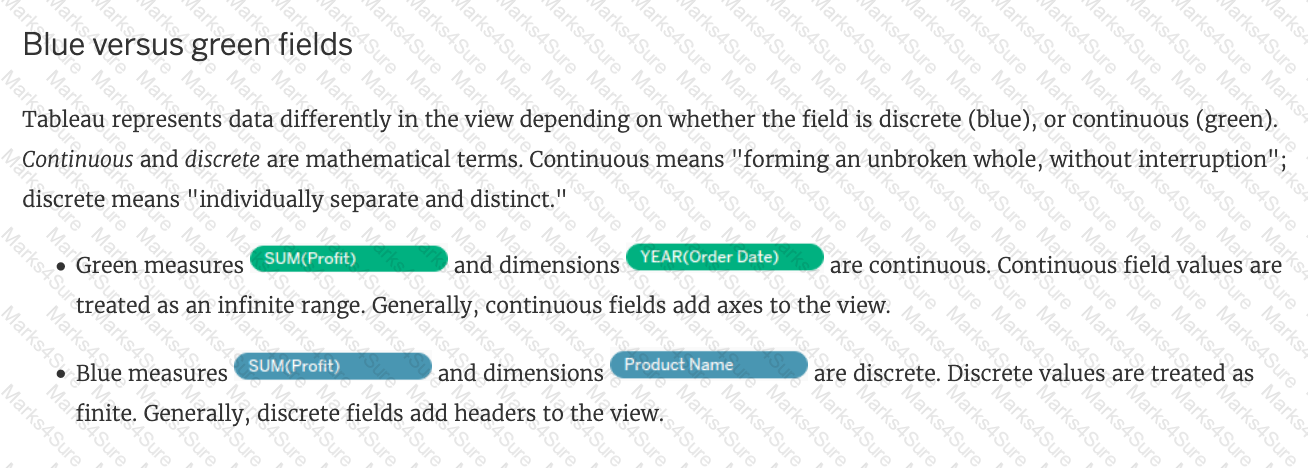
True or False: We get different colour pallete options if we drop a discrete field on " Color " in the marks card compared to if we drop a continous field on Color.
Which of the following is true about ' Incremental refresh ' when creating Extracts in Tableau?

 Text
Description automatically generated
Text
Description automatically generatedSkipped Join the Geo Data and Time Series Table on the Item Number ID column, and display the Store count for every State on a Map. What was the Store count in 2017 for Texas (TX)?
Join the Geo Data and Time Series Table on the Item Number ID column, and display the Store count for every State on a Map. What was the Store count in 2017 for Texas (TX)?
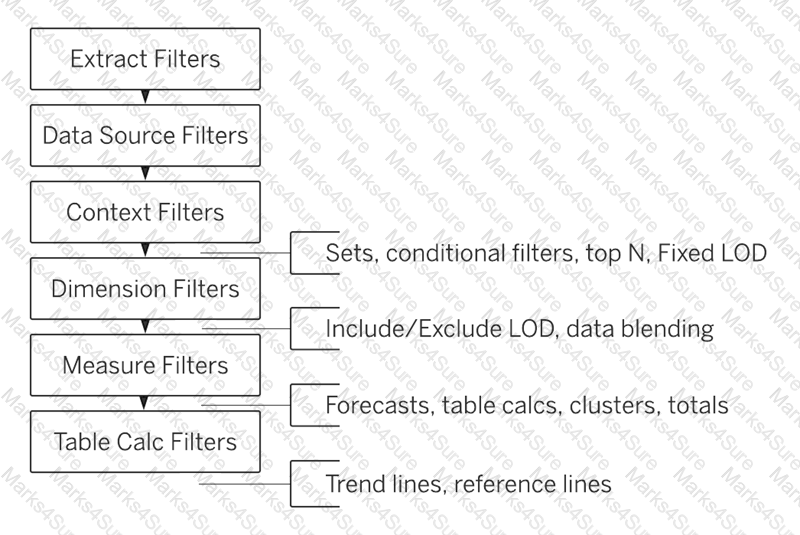
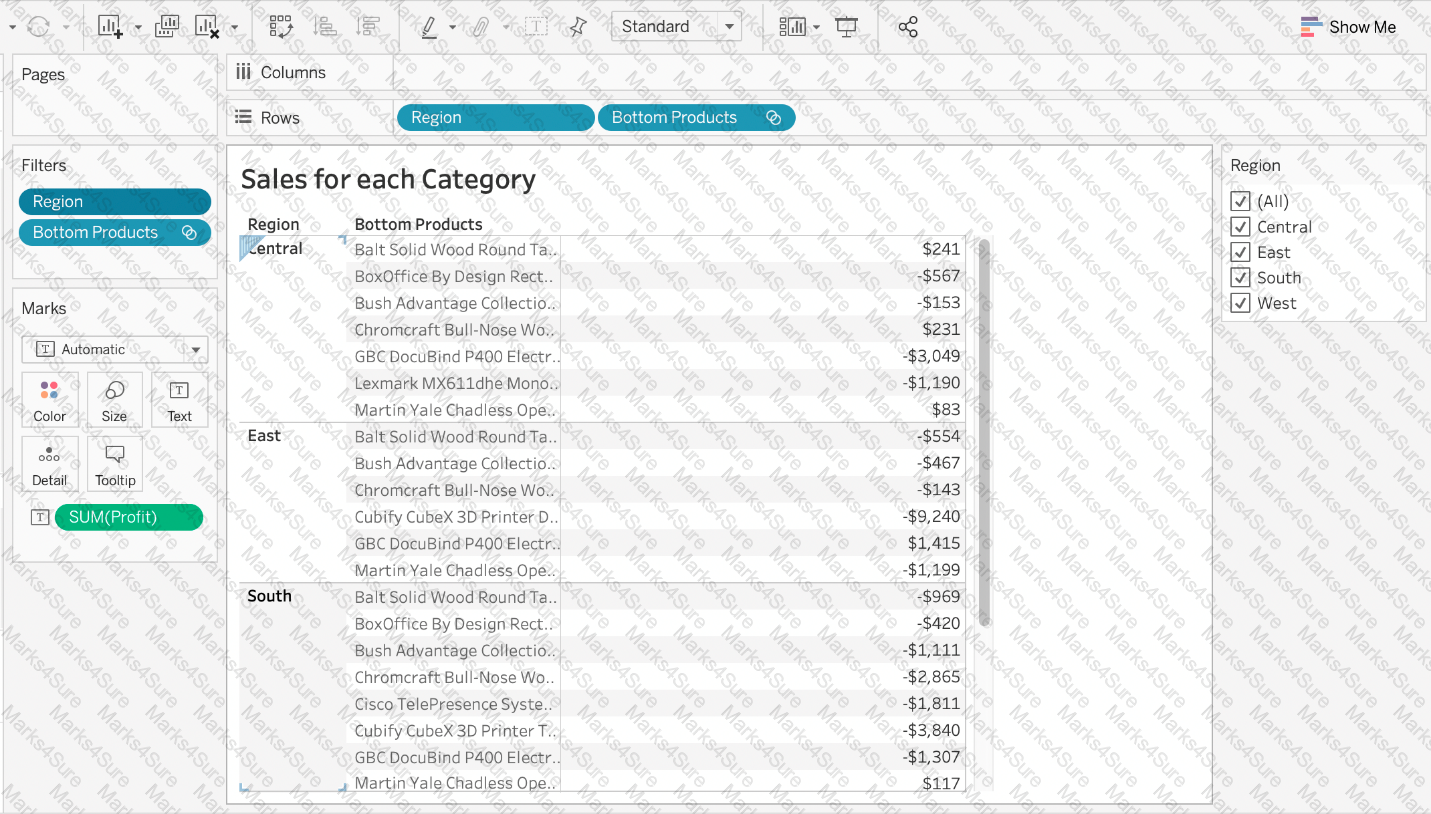
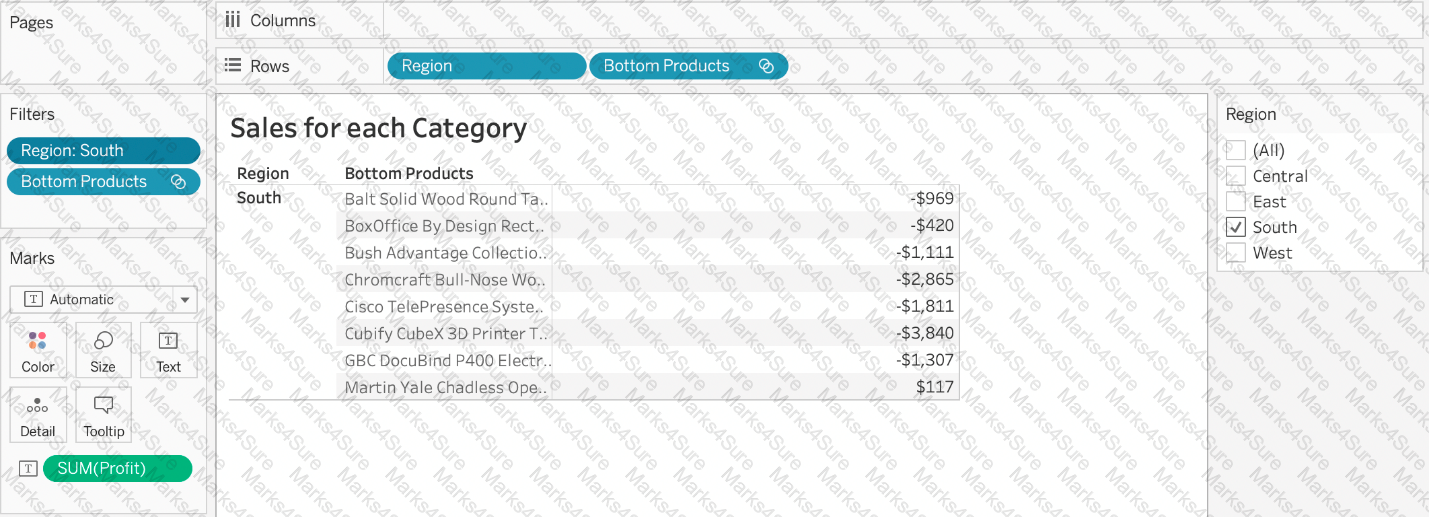
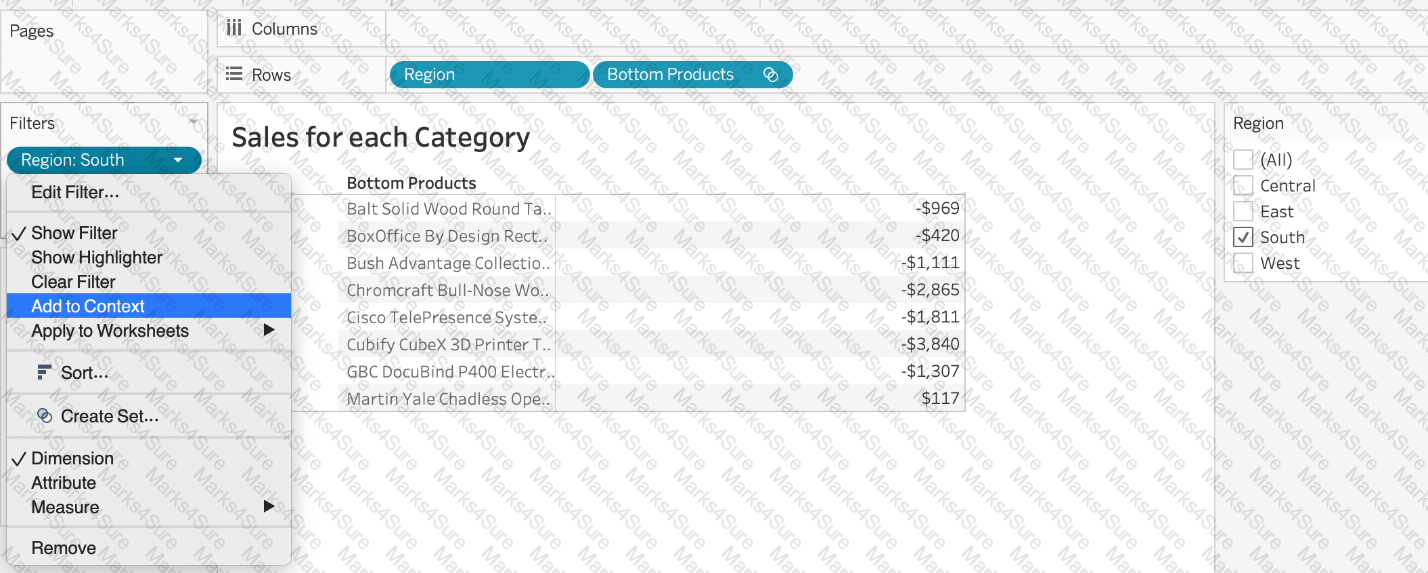
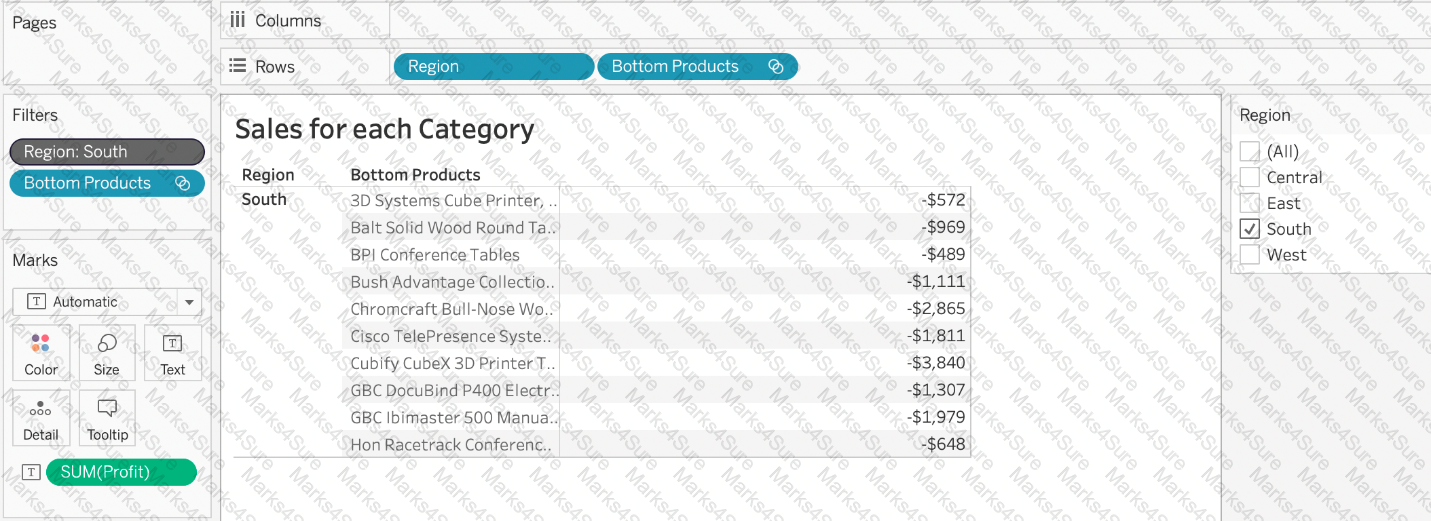
Our use case states that we need to create a set showing the Bottom 10 products by Profit in each Region. Which of the following filter types should you apply on Region?
 Diagram
Description automatically generated
Diagram
Description automatically generated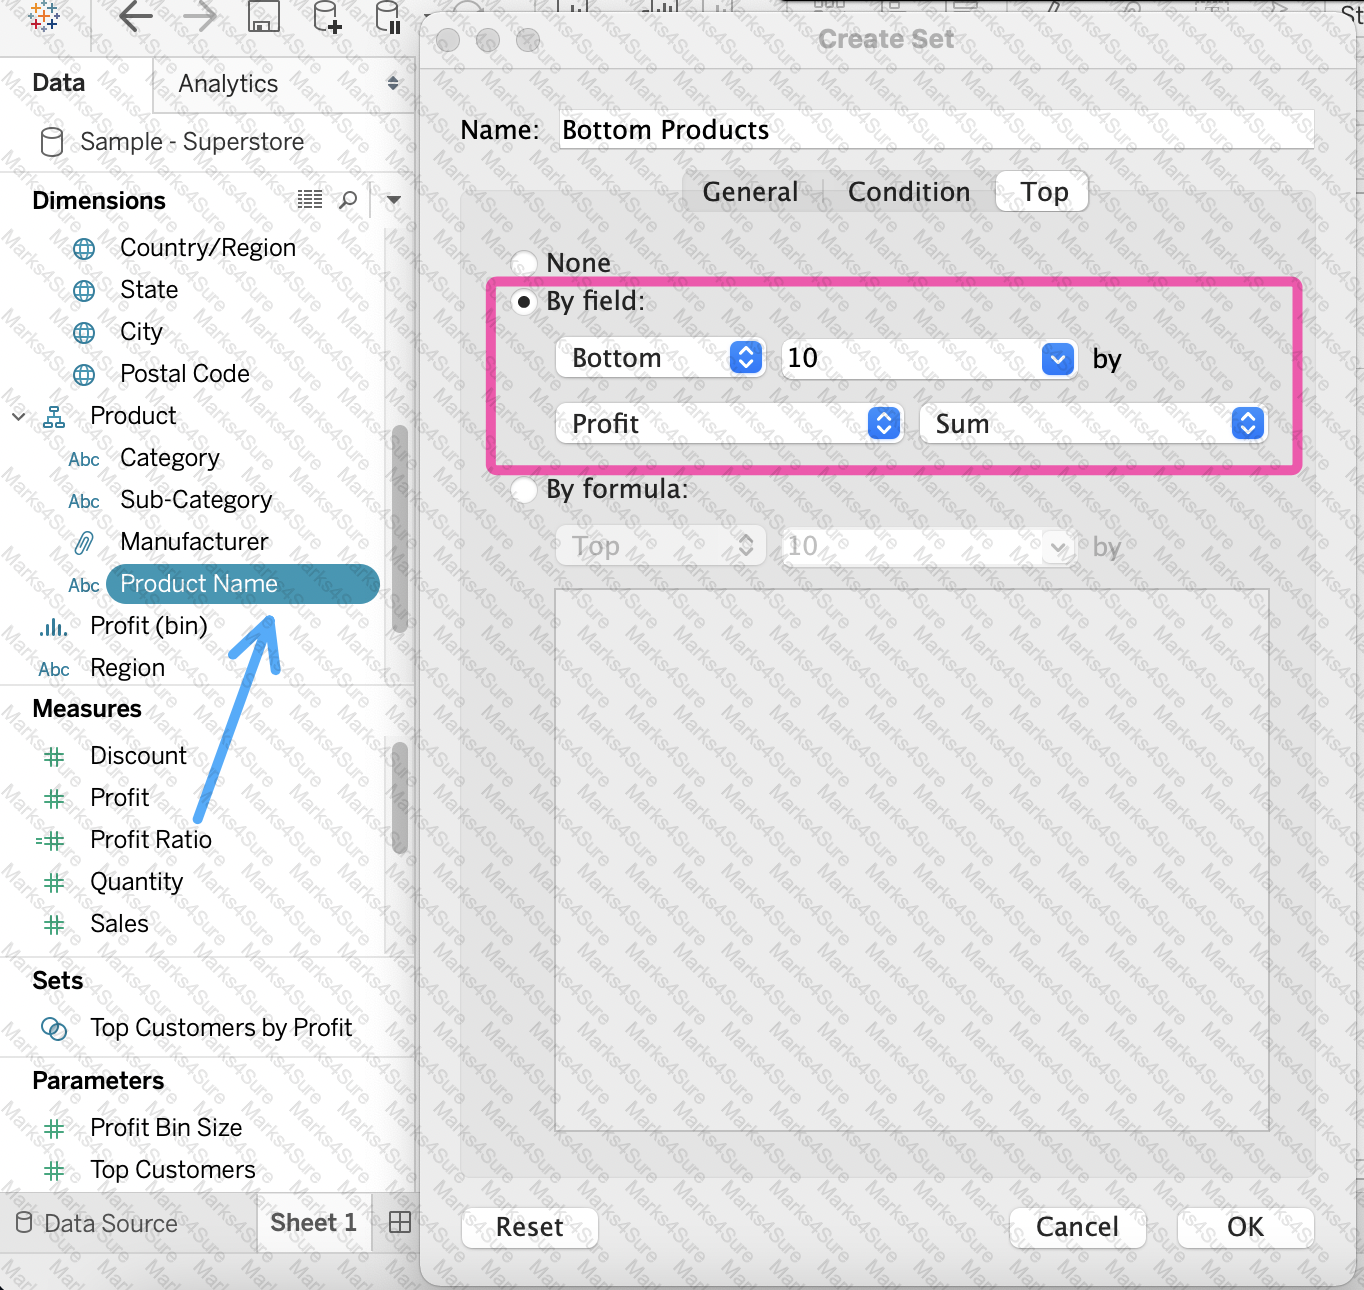
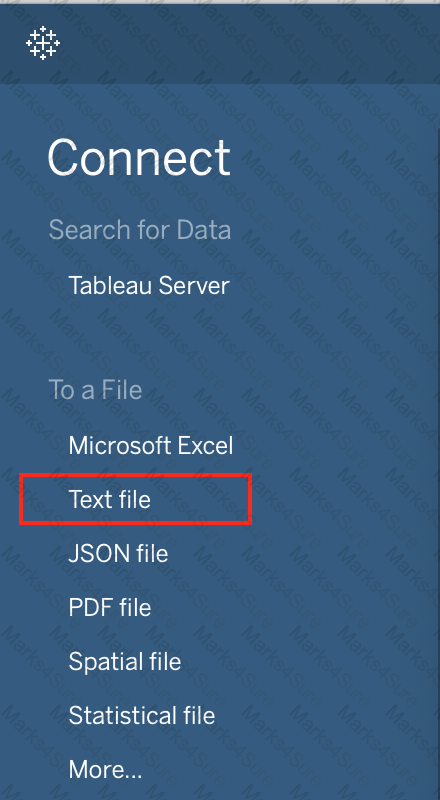
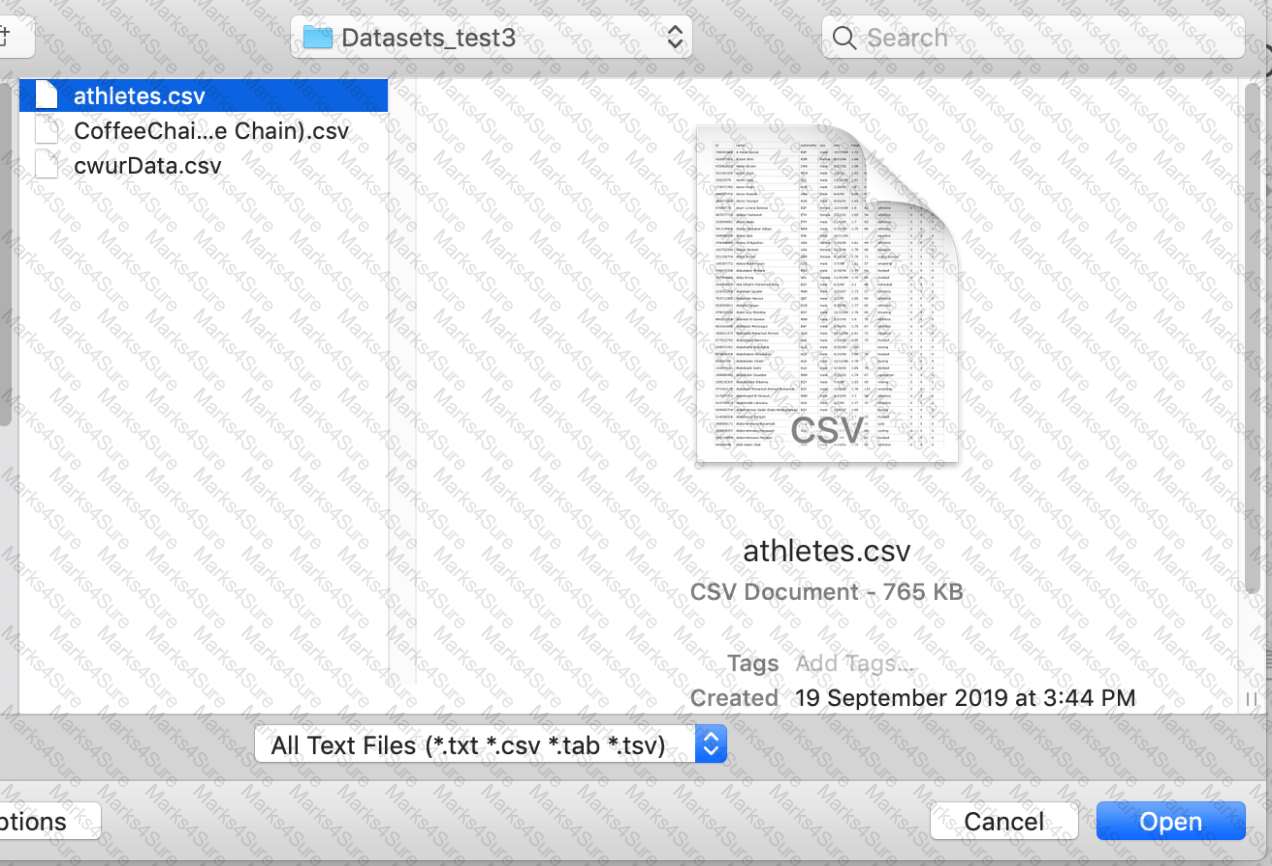
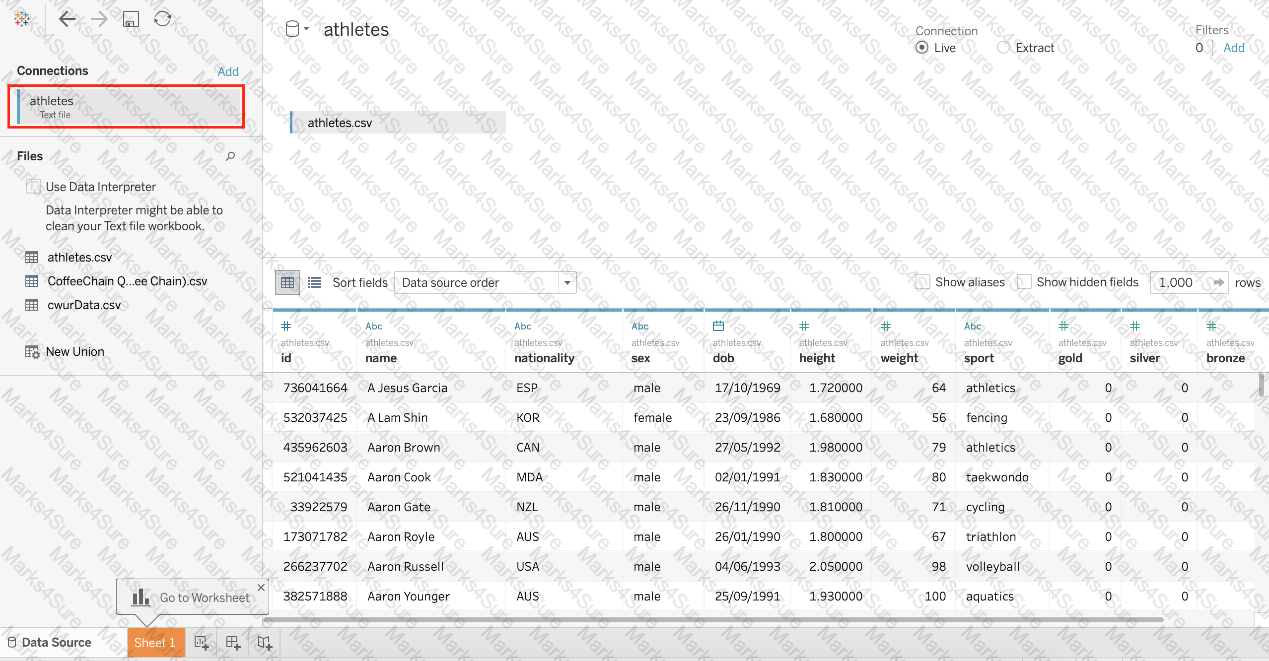
To connect Tableau to a CSV data source what type of connection should you use?
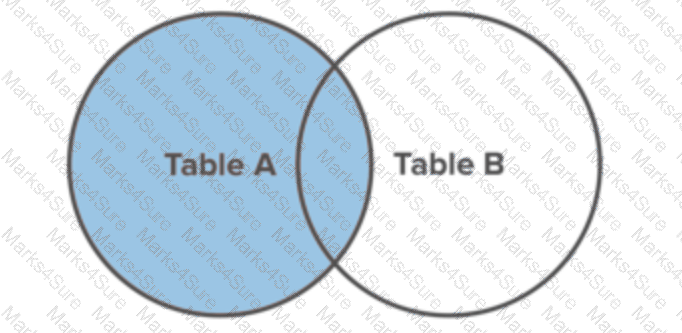
True or False: LEFT JOIN returns all rows from the left table, with the matching rows in the right table

What are two benefits of using a live connection to a data source as compared to an extract? Choose two.
True or False: It is not possible to blend axes for multiple measures into a single axis
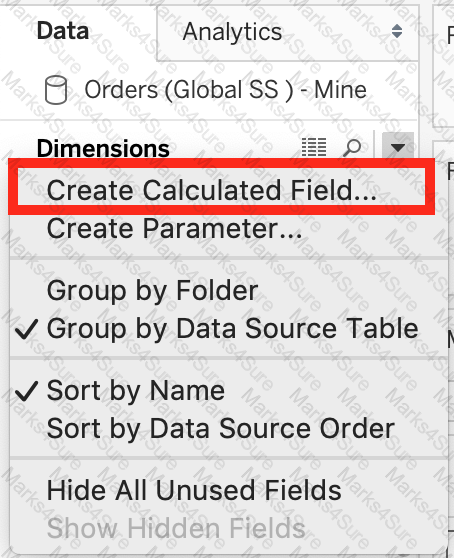
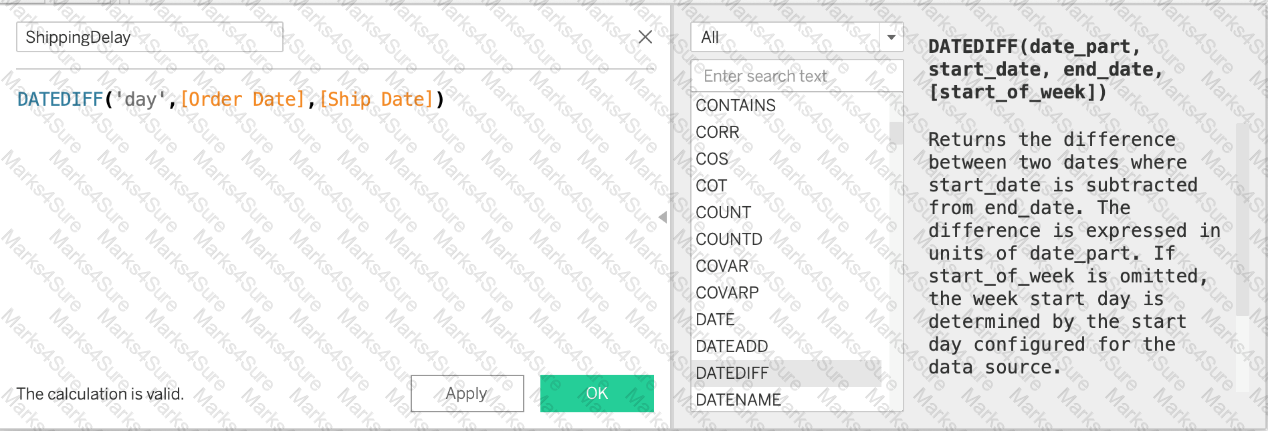
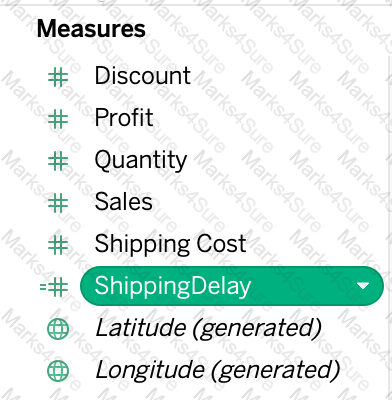
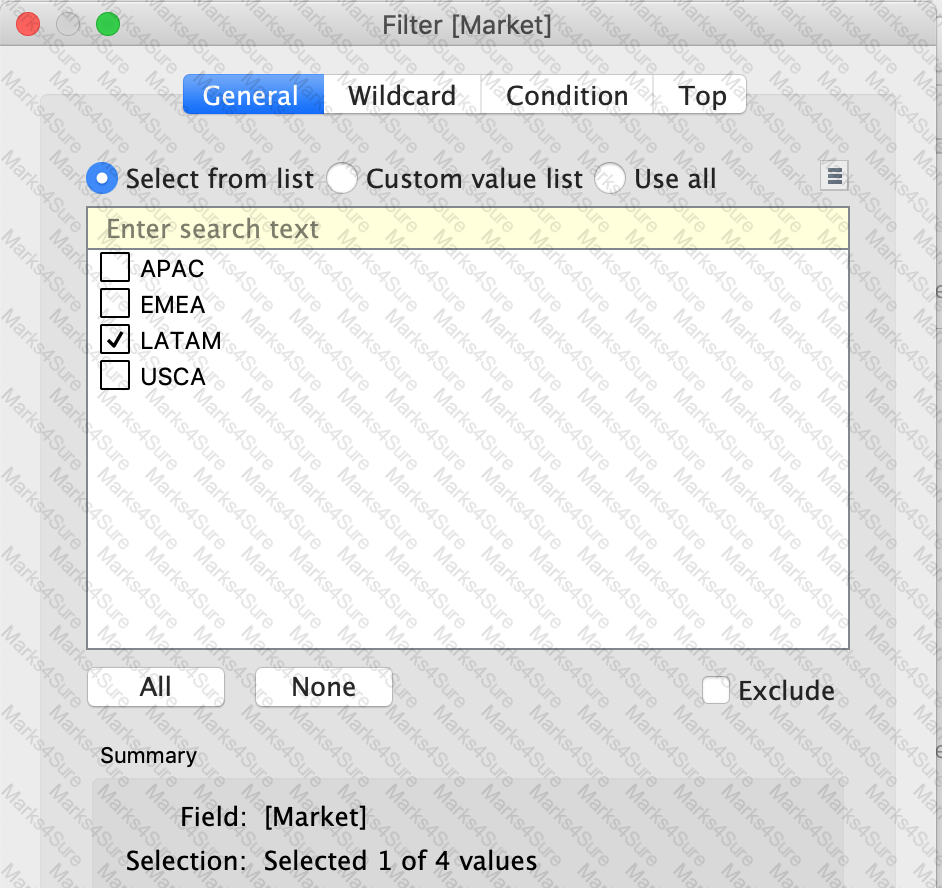
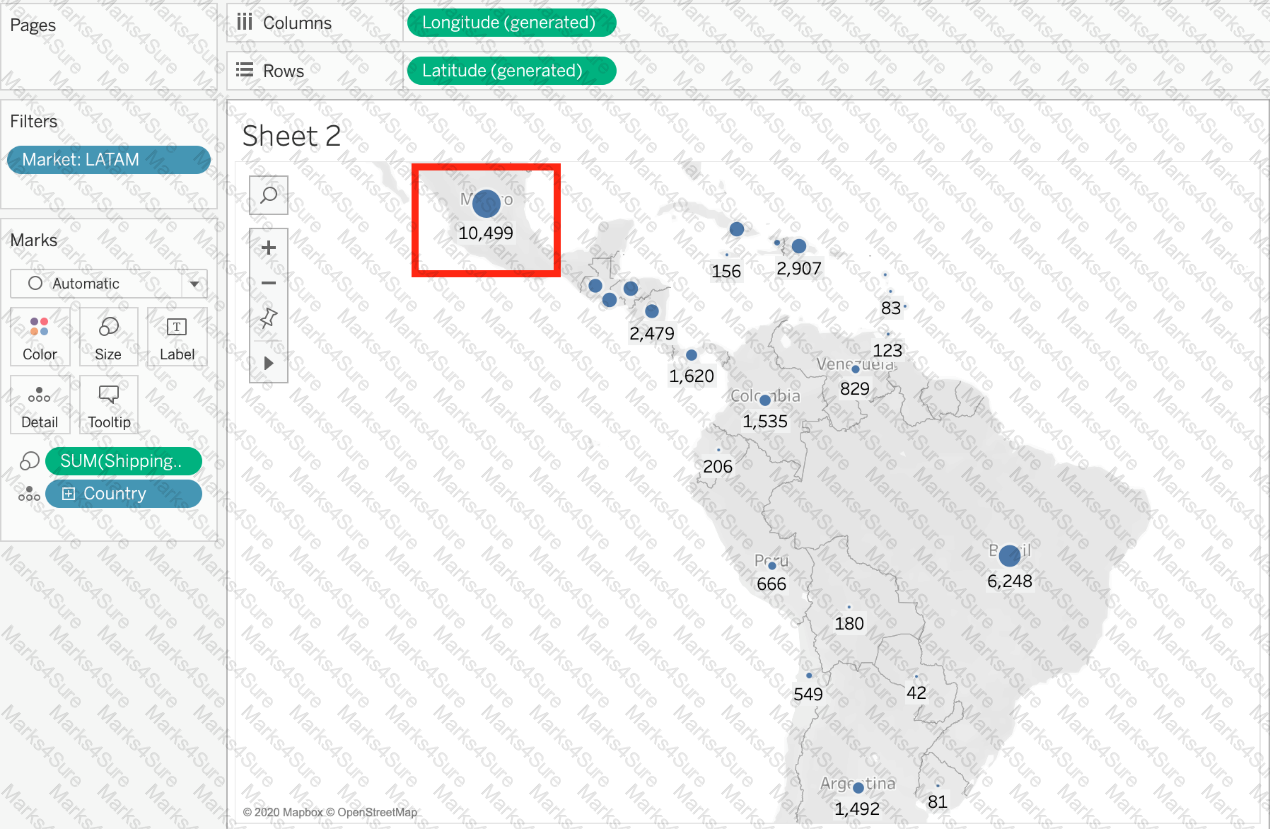
Using the dataset, plot a Map showing all the countries, filtered by Market to only include LATAM. Which country in the LATAM Market has the highest shipping delay (sum of total number of days between the order date and the ship date)?
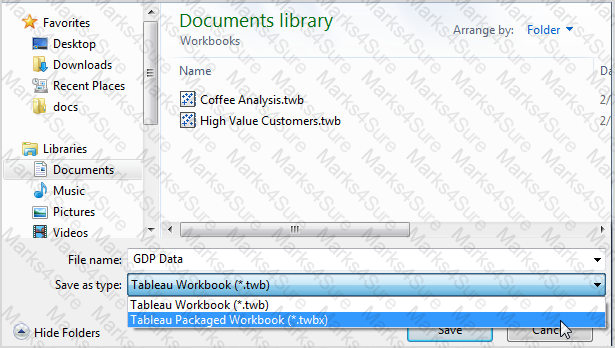
You have cleaned a data source properly, created some calculated fields and renamed some columns. You want to save these changes for future use cases. Which of the following would BEST satisfy this requirement?
PDF + Testing Engine

Testing Engine
PDF (Q&A)