Free Practice Questions for the IASSC Lean Six Sigma Black Belt ICBB Exam (2026 Updated)
At Marks4sure, we are dedicated to providing IT professionals with the most accurate and reliable preparation materials for the IASSC ICBB exam. To support your certification journey, we have made a selection of our premium 2026 Lean Six Sigma Black Belt practice questions and answers available completely free. You can take this practice test as many times as you need. Every question includes a detailed, expertly verified explanation to ensure you fully grasp the core security concepts before test day.
For her injection molding project a Belt needed to track the percentage of defectives of a particular sample set so she used a ___________ to display the data?
Fractional Factorial designs are used to reduce the time and cost of experiments because the ____________ has been lowered.
A(n) ______________ is best used to compare a Machine 1 average quality characteristic to the same quality characteristic of Machine 2.
When a Belt implements an improvement that is automated thus requiring no particular understanding for use he has applied which Lean tool?

Six Sigma is a business improvement discipline whose fundamental view is based on a _________ oriented approach of the business.
The primary objective in removal of waste is to improve the Order Production Cycle where the time from _________________ to the time of receipt of payment is compressed.
Fractional Factorial, ____________and Response Surface Method are types of planned experiments.
Fractional Factorial Designs are used to analyze factors to model the output as a function of inputs if Hypothesis Testing in the Analyze Phase was inadequate to sufficiently narrow the factors that significantly impact the output(s).
Which Experimental Design typically is most associated with the fewest number of input variables or factors in the design?
Which item(s) listed would impact the Process Capability for a process with a continuous output? (Note: There are 4 correct answers).
An operator is measuring the distance between two points. Which is most likely to be influenced by the operator?
Assessing process proportion as opposed to evaluating a process with respect to a set target can be done using which of these?
Use this data to calculate the Z Score. Average of: 92, Standard Deviation: 2, Upper Spec Limit: 101
All the data points that represent the total set of information of interest is called the ________________ .
Which of these graphs demonstrates conditions which would be sufficient to enable OCAP for the process?
Range Charts are the technique used to determine if ______________ are occurring within the subgroups of the SPC Charts.
The most appropriate type of FMEA for a product before going into manufacturing is a ___________ FMEA.
If an experiment has 5 factors and no replicates for a 2-level Experimental Design with 16 experimental runs which statement is incorrect?
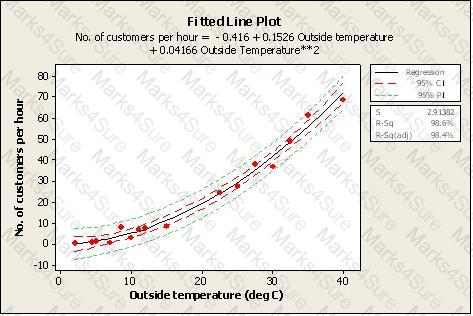
Which statement(s) are correct about the Regression shown here? (Note: There are 2 correct answers).

Questions that can be best answered by a Visual Factory include all of these except _____________________.
What is the Ppk of a process with a spread of 24 units, an average of 68, an upper limit of 82 and a lower limit of 54?
Sally and Sara sell flower pots at their garage sale. Sally motivates Sara mentioning that they will sell a minimum of 22 pots per day if the outside temperature exceeds 60o F. From a sample, whose population is assumed to follow a Normal Distribution, taken for 30 days at 60 degrees or more an average of 18.2 pots per day were sold with a Standard Deviation of 0.9 pots. What is the Z value for this sales process?
When one speaks of 20% of something contributing 80% of the affect they are referring to what is known as the _________________.
Following the completion of a LSS project the Belt not only creates a Control Plan he also develops a _____________ so those involved in the process know what to do when the critical metrics move out of spec.
Which statement(s) are correct about the Regression shown here? (Note: There are 2 correct answers).
Which of these are examples of business metrics or Key Performance Indicators commonly referred to as KPI’s?
Statistical Difference is the magnitude of difference or change required to distinguish between a true difference, brought about by change or improvement, and one that could have occurred by chance.
Upon completion and validation of an improvement to a process a Belt and the Project Team create a Control Plan that contains which of these?
During the ______________ phase of 5S is when we might implement a Red Tag program.
Contingency Tables are used to test for association, or dependency, between two or more classifications.
Which Experimental Design typically is most associated with the fewest number of input variables or factors in the design?
Common and Special Cause ______________ are the focus of Statistical Process Control.
A Belt working in a supply chain environment has to make a decision to change suppliers of critical raw materials for a new product upgrade. The purchasing manager is depending on the Belt’s effort requiring that the average cost of an internal critical raw material component be less than or equal to $4,200 in order to stay within budget. Using a sample of 35 first article components, a Mean of the new product upgrade price of $4,060, and a Standard Deviation of $98 was estimated. Select the answer that best states the Practical Problem.
A valuable tool to use during the Measure Phase to show material and information flow throughout an entire process is the ______________ .
A Full Factorial experiment using a 2 level 4 factor approach has been proposed to test the viability of an extrusion machine experiment. How many treatment combinations will this approach involve?
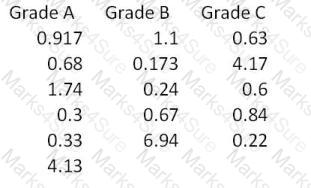
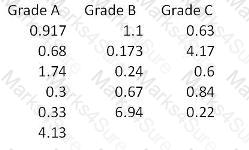
For the data shown here which statement(s) are true? (Note: There are 2 correct answers).
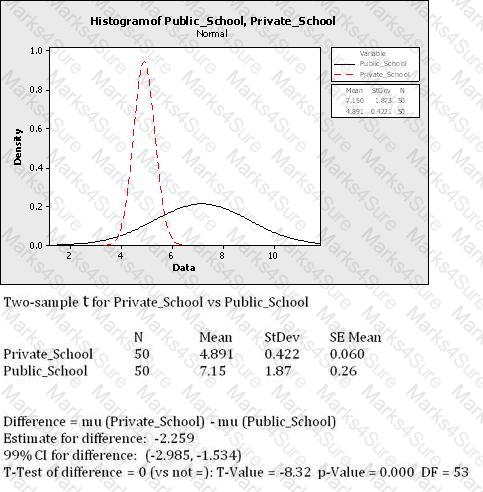
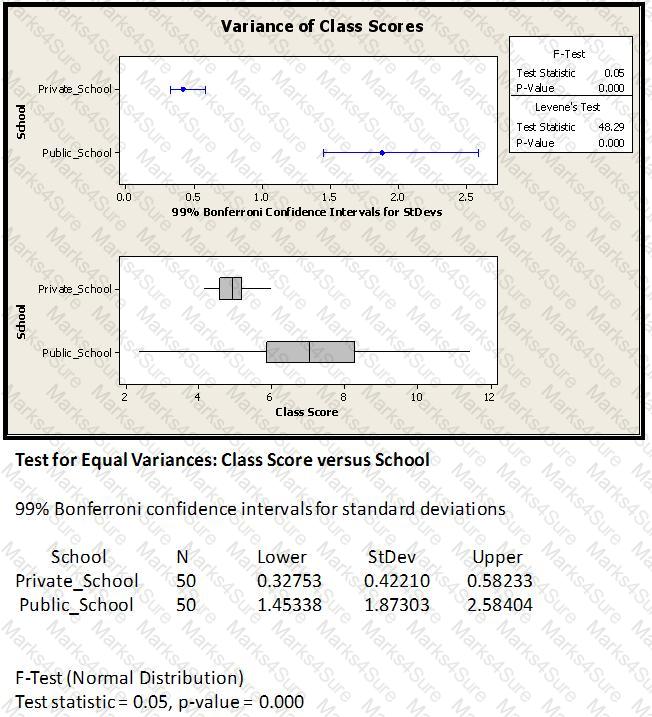
The class score distribution of schools in a metropolitan area is shown here along with an analysis output. Comment on the statistical significance between the Means of the two distributions. Select the most appropriate statement.
From this list select the items that define what an X-Y Diagram is. (Note: There are 4 correct answers).
The calculation of Column Total times Row Total divided by Grand Total yields expected values from what type of chart?
Control Charts were developed by Dr. Shewhart to track data over time. To detect Special Cause variation the Control Charts use which of these?
Kanban establishes a means of monitoring production, conveyance and delivery information such that efficient flow is established. The method used by Kanban is to require a _________ before anything moves.
All the data points that represent the total set of information of interest is called the ________________ .
Contingency Tables are used to test for association, or dependency, between two or more classifications.
Which of these graphical presentations displays the values of each individual reading?
Accuracy can be assessed in several ways and a fairly accurate means of measurement is visual comparison.
Which one of these tools is frequently used to help drill down to possible causes once a Fishbone Diagram is constructed?
Kanban establishes a means of monitoring production, conveyance and delivery information such that efficient flow is established. The method used by Kanban is to require a _________ before anything moves.
The Control Limits width varies if the sample size varies for which type of chart?
Fractional Factorial Designs are used to analyze factors to model the output as a function of inputs if Hypothesis Testing in the Analyze Phase was inadequate to sufficiently narrow the factors that significantly impact the output(s).
A natural logarithmic base is not required for which of these distributions for probability calculations?
Sally and Sara sell flower pots at their garage sale. Sally motivates Sara mentioning that they will sell a minimum of 15 pots per day if the outside temperature exceeds 60o F. From a sample, whose population is assumed to follow a Normal Distribution, taken for 30 days at 60 degrees or more an average of 13.6 pots per day were sold with a Standard Deviation of 0.7 pots. The statistical Degrees of Freedom for this example are?
A valid mathematical Regression represents all of the characteristics shown except _________________.
Relative to a Design of Experiments the term ________________ refers to variables being a linear combination of each other.
A Lean Six Sigma project is attempting to reduce inventory days. The Process Capability will be monitored as part of the Control Phase to track the sustainability of the improvement.

Which distribution type is best used for performing the Capability Analysis?
For Attribute Data, Process Capability is defined as the average proportion of nonconforming products.
As a means of measuring the effects on other areas of a process as a result of changes in the primary metric we also define and track ________________.
At the very initiation of a project a Belt must develop a concise _______________ that states at a high level the area of concern and why it is important this issue be improved.
A Lean Six Sigma project is attempting to reduce inventory days. The Process Capability will be monitored as part of the Control Phase to track the sustainability of the improvement.
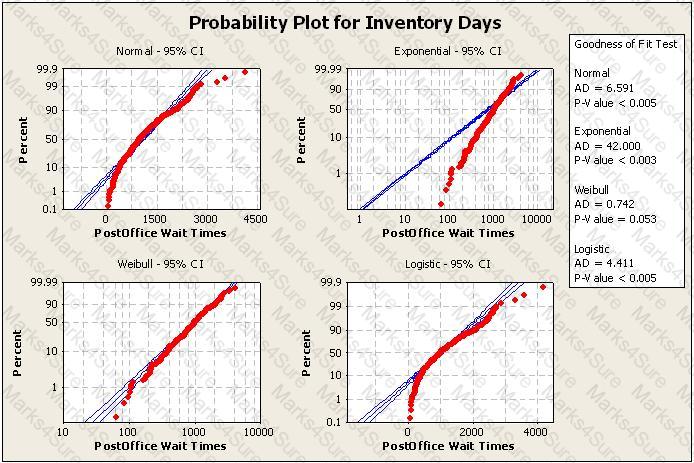
Which distribution type is best used for performing the Capability Analysis?
Situations where standardized work needs to be incorporated include all of these except _____________________.
One of the primary deliverables from performing a SIPOC is to begin to understand which outputs have the greatest affect on the customer most valued inputs.
“A calculated time frame that matches customer demand” is a definition of what Lean Principles term?
Since Normality is required if we intend to use the data collected as a predictive tool. To test for Normality of data we must determine if the P-value is ___________.
When analyzing the behavior of our process to assess customer satisfaction we are concerned about both the variation such that it stays within the spec limits and how well the Mean is __________________ the process requirements.

Statistical Difference is the magnitude of difference or change required to distinguish between a true difference, brought about by change or improvement, and one that could have occurred by chance.
The reported Cpk for a process with an average of 104 units, a spread of 18 units and upper and lower specification limits of 122 and 96 units would be?
The distance between the Mean of a data set and the Point of Inflection on a Normal curve is called the _______________.
When one speaks of 20% of something contributing 80% of the affect they are referring to what is known as the _________________.
A(n) ______________ is best used to compare a Machine 1 average quality characteristic to the same quality characteristic of Machine 2.
An operator checks that all boxes being packed contain enough products to fill the box. However, each box getting filled has a different number of products in it. This is a Reproducibility problem, not a Repeatability problem.
For a Normal Distribution as samples size increases the Range in Mean and Standard Deviation decrease relative to the Mean and Standard Deviation of the population.
When variation is removed from the output of a process then the process customer can have more confidence in the experience that results from the process.
Production Line 1 is able to complete 500 units per shift. Production Line 2 is able to finish 1,500 units per shift. Production Line 2 is 3 times faster than Production Line 1. This analysis is an example of ______________ Scale Data.
A valid Multiple Linear Regression (MLR) is characterized by all of these except _______________________.
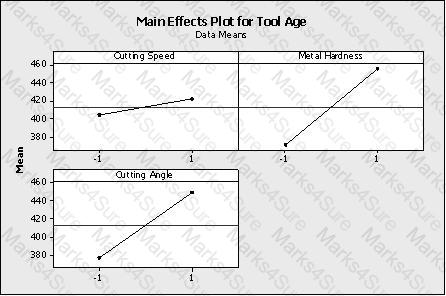
Which statement(s) are correct about the DOE Factorial plot output here? (Note: There are 3 correct answers).
The Normal Distribution is considered to be the most important distribution in statistics and, among other things is defined as having a total area under the curve of 1, is mounded and symmetrical and the Mean, Median and Mode are _____________.
Which of these might contribute to similar distributions having Unequal Variance?
PDF + Testing Engine

Testing Engine
PDF (Q&A)