Free Practice Questions for the Microsoft Certified: Power BI Data Analyst Associate PL-300 Exam (2026 Updated)
At Marks4sure, we are dedicated to providing IT professionals with the most accurate and reliable preparation materials for the Microsoft PL-300 exam. To support your certification journey, we have made a selection of our premium 2026 Microsoft Certified: Power BI Data Analyst Associate practice questions and answers available completely free. You can take this practice test as many times as you need. Every question includes a detailed, expertly verified explanation to ensure you fully grasp the core security concepts before test day.
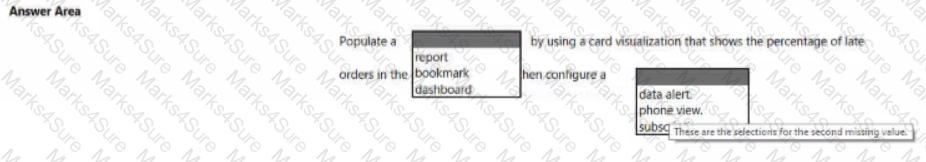
You need to create a solution to meet the notification requirements of the warehouse shipping department.
What should you do? To answer, select the appropriate options in the answer area.
NOTE: Each correct select is worth one point:

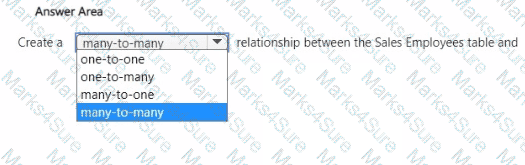
You need to create a relationship in the data model for RLS.
What should you do? To answer, select the appropriate options in the answer area.
NOTE: Each correct selection is worth one point.

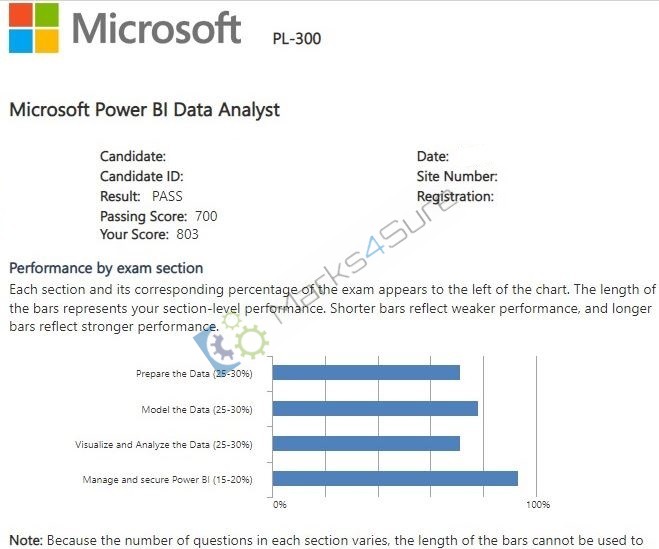
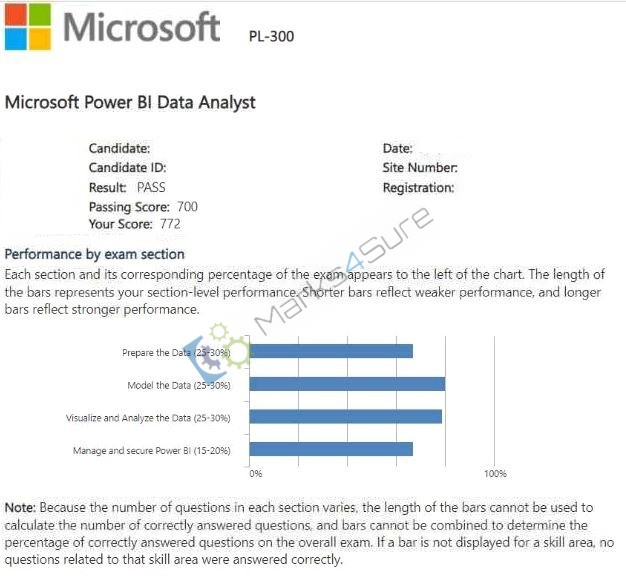
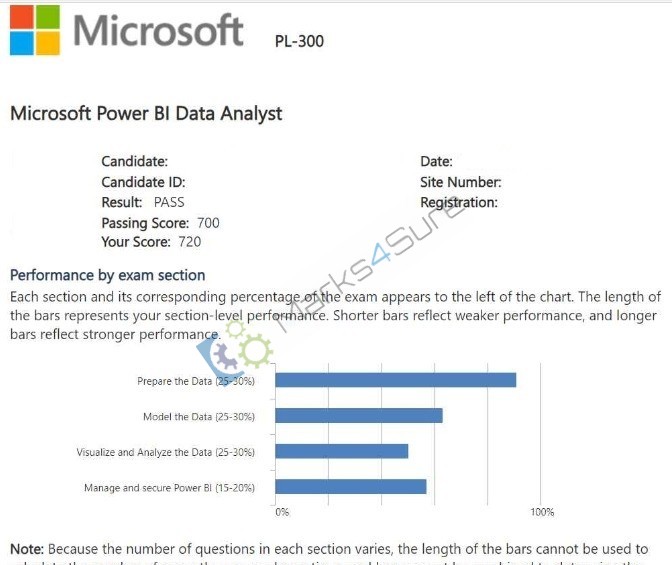
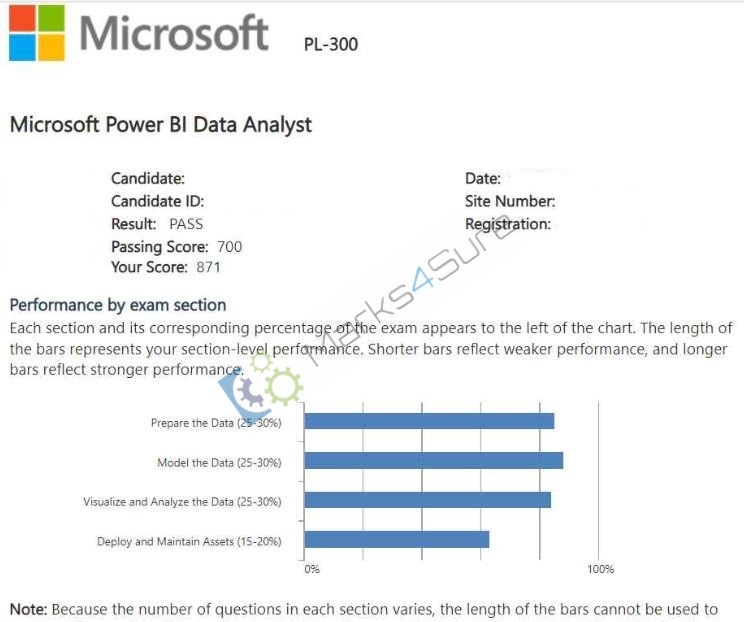
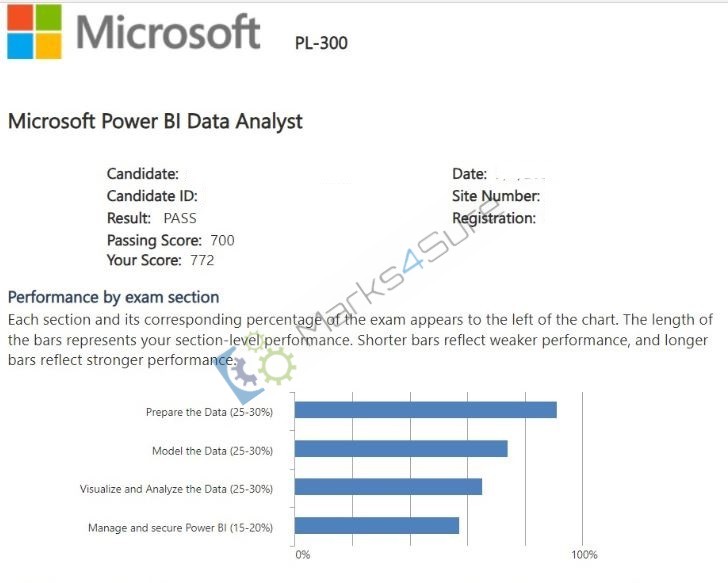
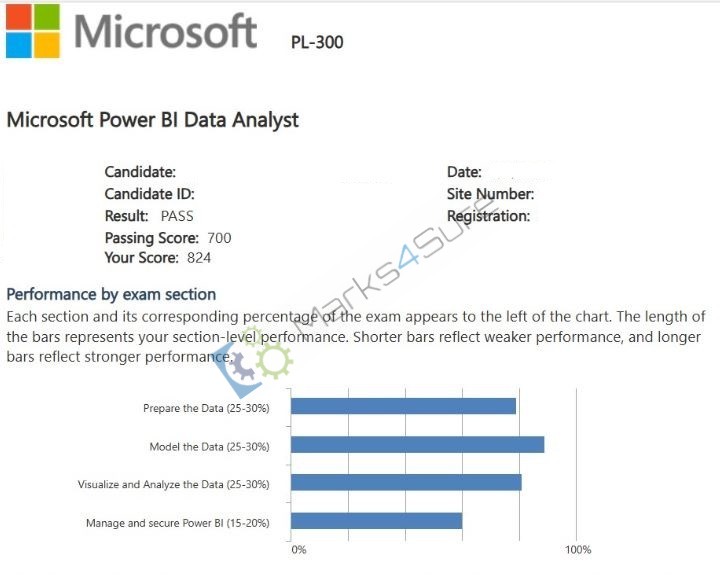
PL-300 Report Card
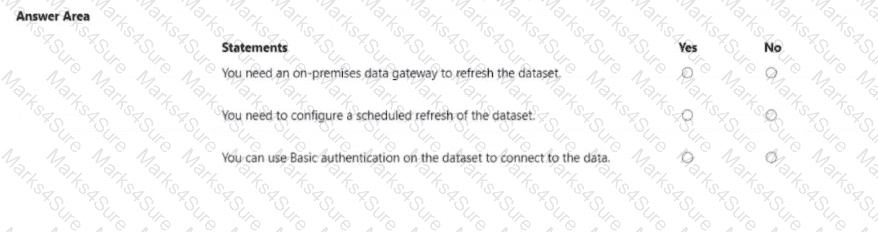
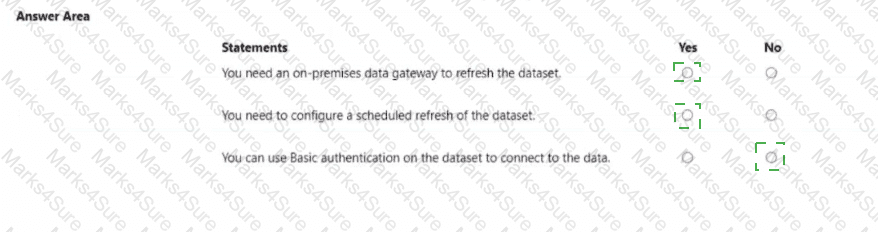
You publish the dataset to powerbi.com.
For each of the following statements, select Yes if the statement is true. Otherwise, select No.
NOTE: Each correct selection is worth one point.
What should you create to meet the reporting requirements of the sales department?
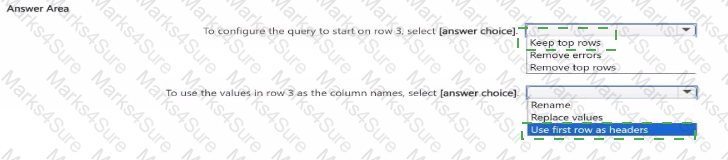
You need to address the data concerns before creating the data model. What should you do in Power Query Editor?
You have a report that contains a donut chart and a clustered column chart. Interactions between the visuals use the default settings.
You need to modify the report so that when you select a column m the column chart, the donut chart redraws by using the data from the selected column.
What should you do?
You have a data source that contain a column. The column contains case sensitive data.
You have a Power BI semantic model in DirectQuery mode.
You connect to the model and discover that it contains undefined values and errors.
You need to resolve the issue.
Solution: You implicitly convert the values into the required types.
Does this meet the goal?
You have a PBiX file that imports several tables from an Azure SQL database.
The data will be migrated to another Azure SQL database.
You need to change the connections in the PBIX file. The solution must minimize administrative effort.
What should you do?
You need to create the relationship between the product list and the revenue results. The solution must minimize the time it takes to render visuals.
What should you set as the relationship cardinality?
You need to create relationships to meet the reporting requirements of the customer service department.
What should you create?
You need to ensure that the data is updated to meet the report requirements. The solution must minimize configuration effort.
What should you do?
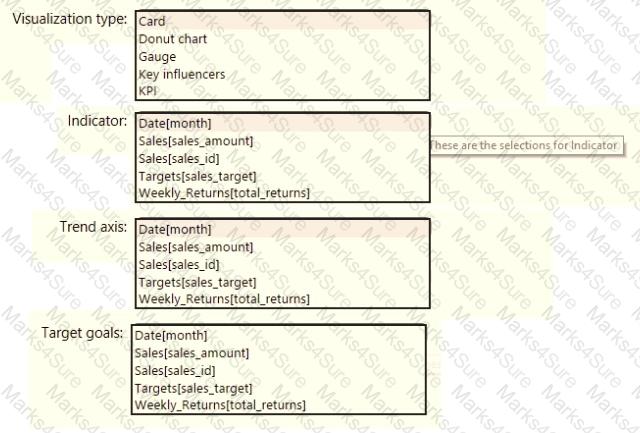
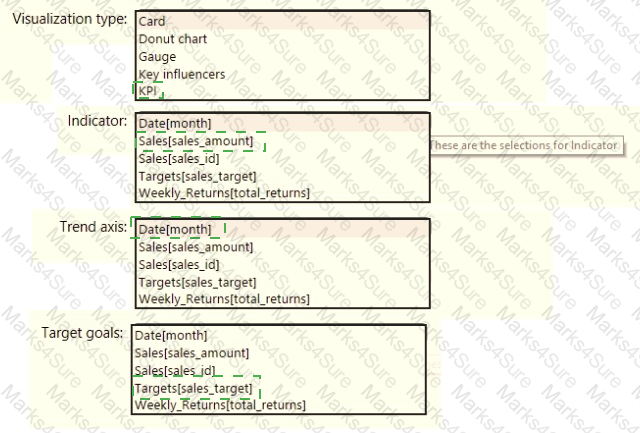
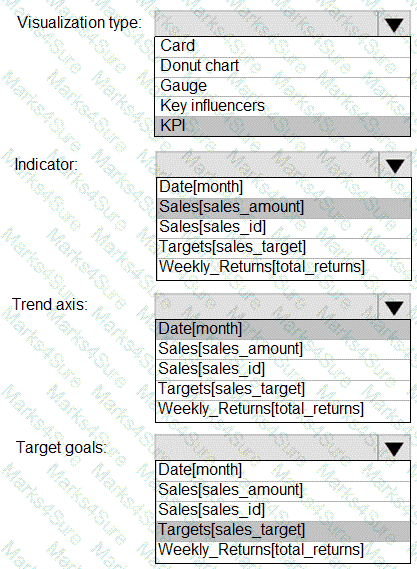
You need to create a visualization to meet the reporting requirements of the sales managers.
How should you create the visualization? To answer, select the appropriate options in the answer area.
NOTE: Each correct selection is worth one point.
You use Power Query to import two tables named Order Header and Order Details from an Azure SQL database. The Order Header table relates to the Order Details table by using a column named Order ID in each table.
You need to combine the tables into a single query that contains the unique columns of each table.
What should you select in Power Query Editor?
You need to design the data model to meet the report requirements.
What should you do in Power BI Desktop?
You need to provide a solution to provide the sales managers with the required access.
What should you include in the solution?
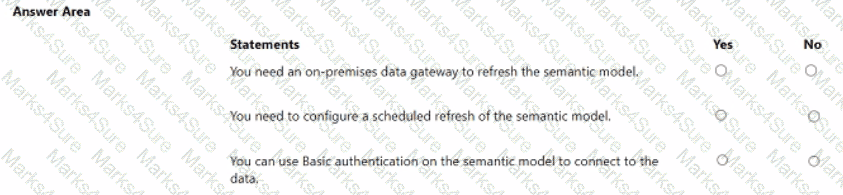
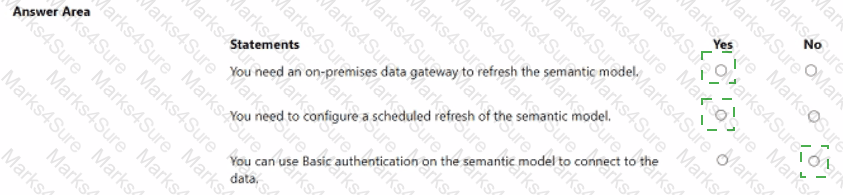
You publish the semantic model to powerbi.com.
For each of the following statements, select Yes if the statement is true. Otherwise, select No.
NOTE: Each correct selection is worth one point.
You need to get data from the Microsoft SQL Server tables. What should you use to configure the connection '
You need to create a relationship between the Weekly_Returns table and the Date table to meet the reporting requirements of the regional managers. What should you do?
You need to create the required relationship for the executive ' s visual. What should you do before you can create the relationship?
You need to create a calculated column to display the month based on the reporting requirements. Which DAX expression should you use?
Which DAX expression should you use to get the ending balances in the balance sheet reports?
How should you distribute the reports to the board? To answer, select the appropriate options in the answer area.
NOTE: Each correct selection is worth one point.
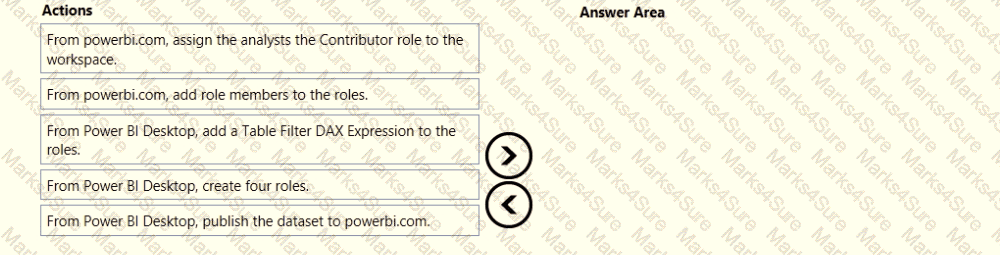
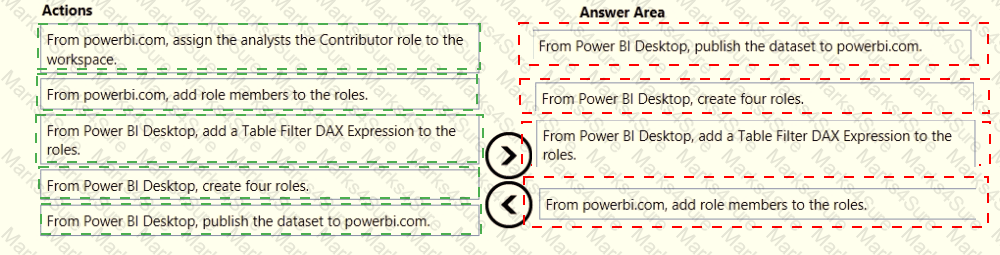
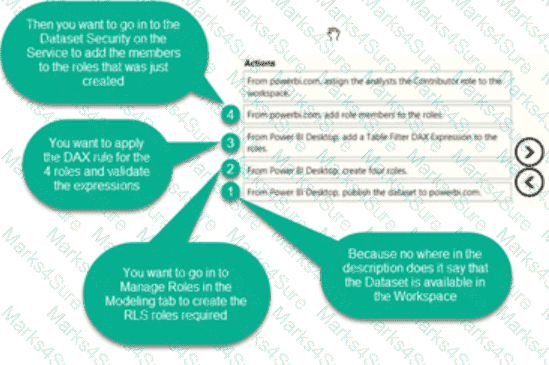
Once the profit and loss dataset is created, which four actions should you perform in sequence to ensure that the business unit analysts see the appropriate profit and loss data? To answer, move the appropriate actions from the list of actions to the answer area and arrange them in the correct order.
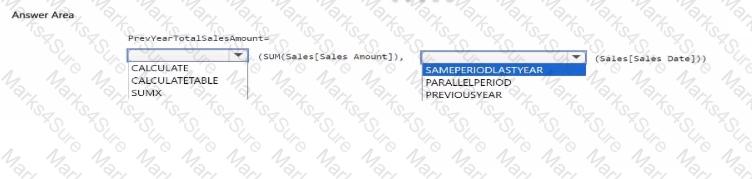
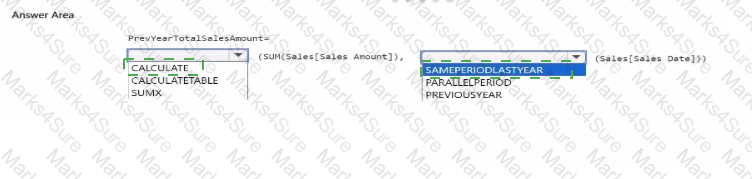
You have a semantic model that contains a table named Sales. The table contains the following columns;
• Order ID
• Product ID
• Sales Dote
• Sales Amount
You need to create a DAX measure that will return the total sales amount for the same dates from the previous year. How should you complete the measure? To answer, select the appropriate options m the answer area.
NOTE: Each correct selection is worth one point.
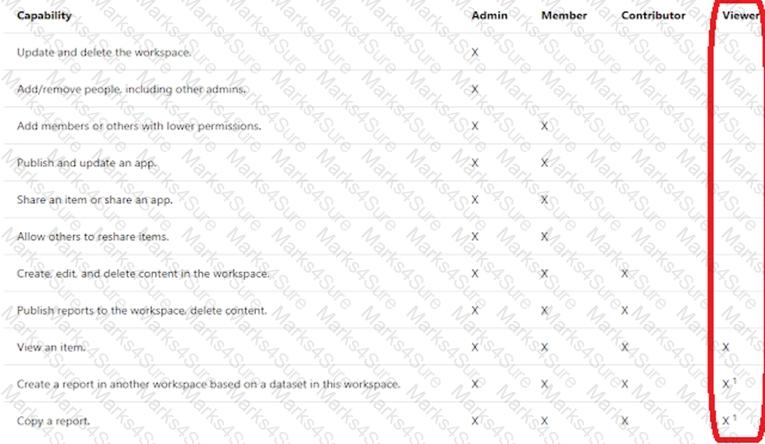
You have a Power Bl workspace that contains a dataset. a report, and a dashboard. The following groups have access:
• External users can access the dashboard.
• Managers can access the dashboard and a manager-specific report.
• Employees can access the dashboard and a row-level security (RLS) constrained report.
You need all users, including the external users, to be able to tag workspace administrators if they identify an issue with the dashboard. The solution must ensure that other users see the issues that were raised.
What should you use?
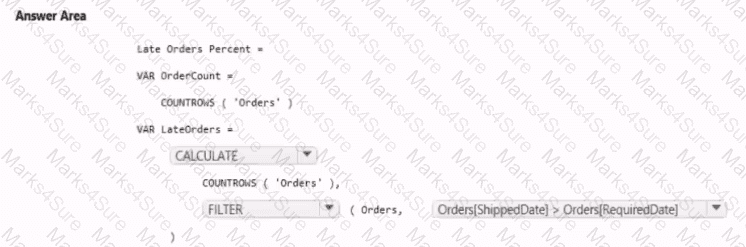
You need to create a measure that will return the percentage of late orders.
How should you complete the DAX expression? To answer, select the appropriate options in the answer area.
NOTE: Each correct selection is worth one point.

You have a Power BI app named App1. The privacy for the App1 workspace is set to Private.
A user named User1 reports that App1 does not appear in the My organization AppSource. App1 appears in the My organization AppSource for your account.
You need to ensure that User sees App1 from the My organization AppSource.
What should you do?
You have a Power Bl report named Report1 and a dashboard named Dashboard1, Report1 contains a line chart named Sales by month.
You pin the Sales by month visual to Dashboard1.
In Report1, you change the Sales by month visual to a bar chart.
You need to ensure that bar chart displays on Dashboard1.
What should you do?
You are creating a Microsoft Power BI data model that has the tables shown in the following table.
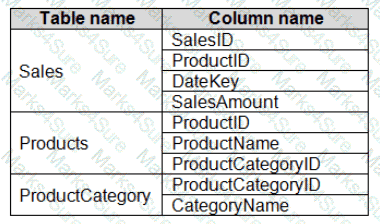
The Products table is related to the ProductCategory table through the ProductCategoryID column.
You need to ensure that you can analyze sales by product category.
How should you configure the relationships from Products to ProductCategory? To answer, select the appropriate options in the answer area.
NOTE: Each correct selection is worth one point.
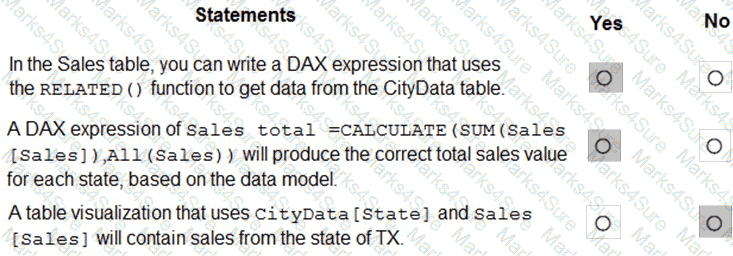
You are creating a Microsoft Power Bl model that has two tables named CityData and Sales. CityData contains only the data shown in the following table.
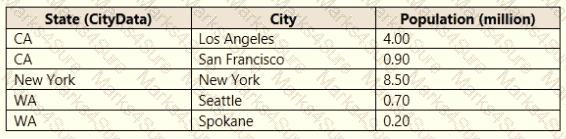
Sales contains only the data shown in the following table.
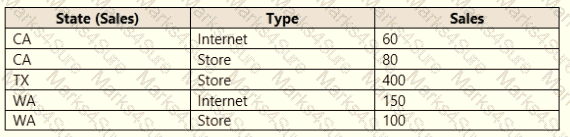
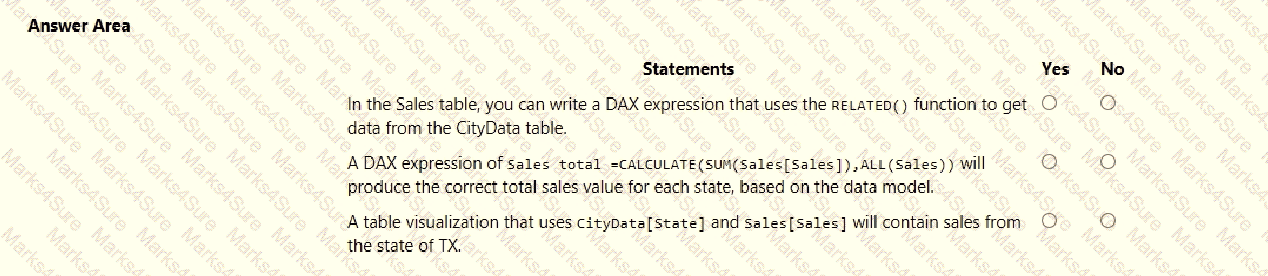
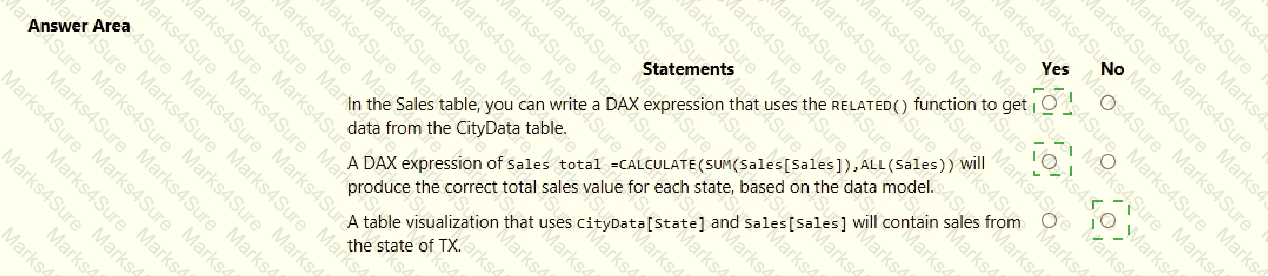
For each of the following statements, select Yes if the statement is true. Otherwise, select No.
NOTE: Each correct selection is worth one point.
You plan to use Power Bl Desktop to create a bog tracking dashboard that will pull data from Analytics in Azure DevOps.
From Power Bl Desktop, you need to configure a data connector to authenticate to Azure DevOps. The solution must meet the following requirements:
• Use Analytics views.
• Filter data from the cloud.
Which connector should you use?
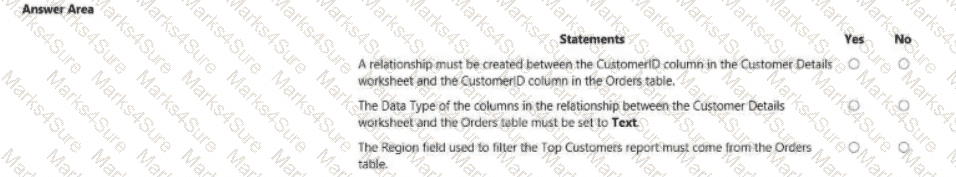
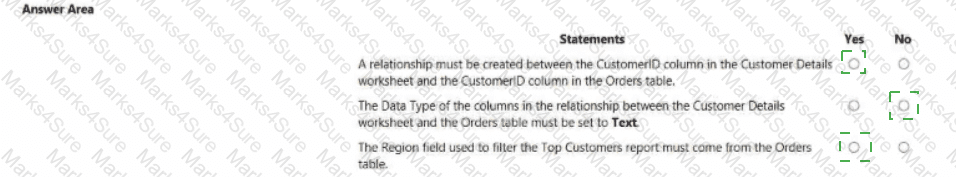
You need to design the data model and the relationships for the Customer Details worksheet and the Orders table by using Power BI. The solution must meet the report requirements.
For each of the following statement, select Yes if the statement is true, Otherwise, select No.
NOTE: Each correct selection is worth one point.
You need to minimize the size of the semantic model. The solution must meet the report requirements.
What should you do?
You need to recommend a strategy to consistently define the business unit, department, and product category data and make the data usable across reports.
What should you recommend?
You have the Power Bl model shown in the following exhibit.
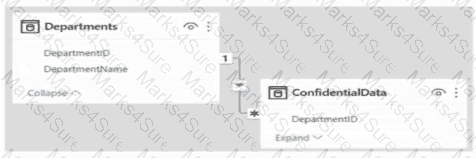
There are four departments in the Departments table.
You need to ensure that users can see the data of their respective department only.
What should you do?
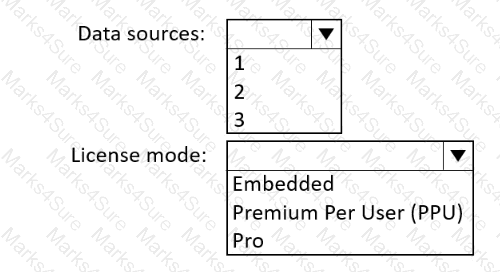
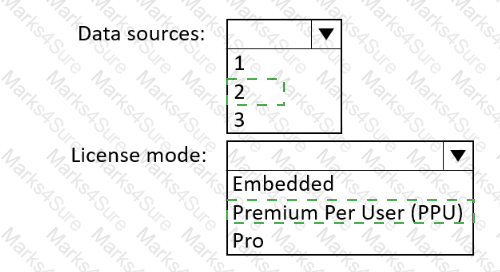
You have a semantic model named Model1 that will be used to support reports viewed in the Power BI service.
Model1 contains data from the following sources:
An Azure SQL database that is accessible only via a private endpoint
A Microsoft Excel file stored in Microsoft SharePoint Online
A Microsoft SQL Server database in a private datacenter
You need to publish Model1 and schedule the model to refresh 12 times a days.
How many data sources require a data gateway, and which license mode will the workspace require to support the scheduled refresh? To answer, select the appropriate options in the answer area.
NOTE: Each correct selection is worth one point.
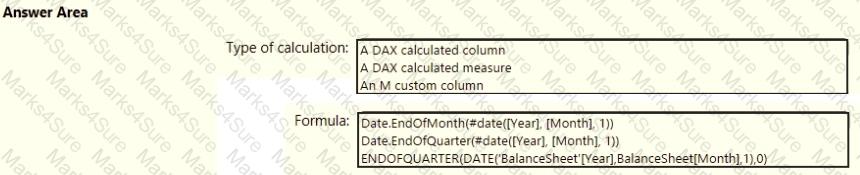
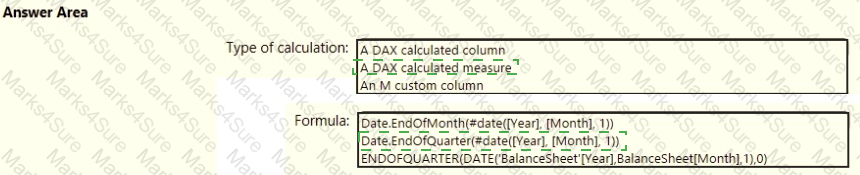
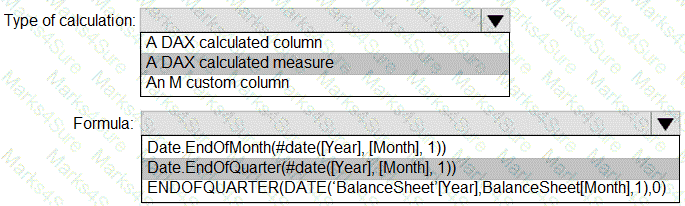
You need to calculate the last day of the month in the balance sheet data to ensure that you can relate the balance sheet data to the Date table. Which type of calculation and which formula should you use? To answer, select the appropriate options in the answer area. NOTE: Each correct selection is worth one point.
You need to create the On-Time Shipping report. The report must include a visualization that shows the percentage of late orders.
Which type of visualization should you create?
You need to configure access for the sales department users. The solution must me meet the security requirements. What should you do?
You need to minimize me size of the dataset. The solution must meet the report requirements What should you do?
You build a report to analyze customer transactions from a database that contains the tables shown in the following table.
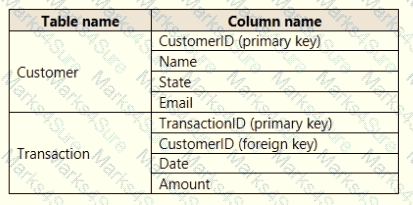
You import the tables.
Which relationship should you use to link the tables?
You merge data from Sales.Region, Region_Manager, Sales_Manager, and Manager into a single table named Region. What should you do next to meet the reporting requirements of the executives?
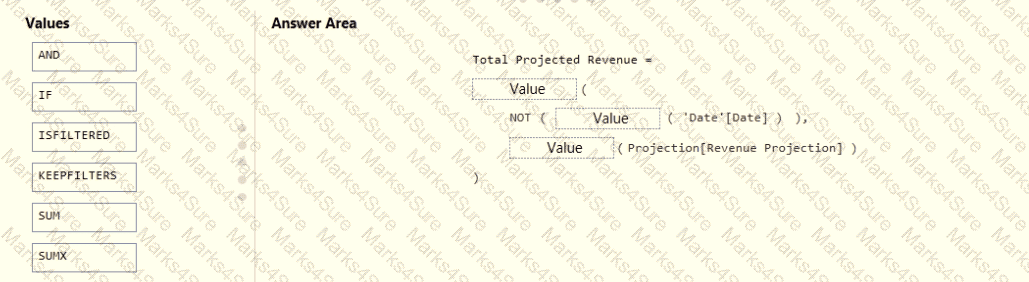
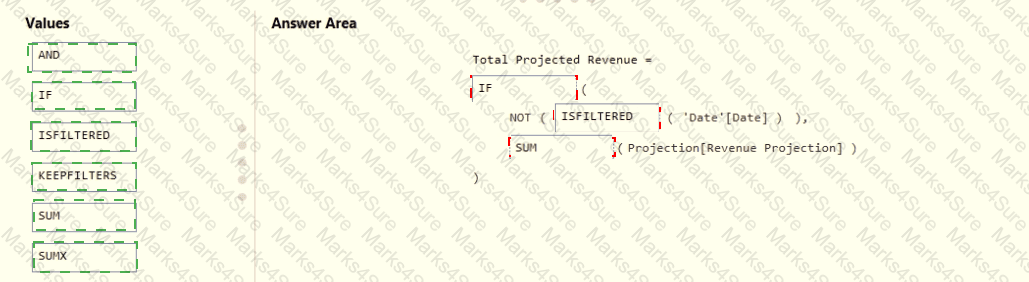
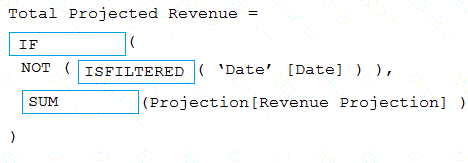
You need to create a DAX measure in the data model that only allows users to see projections at the appropriate levels of granularity.
How should you complete the measure? To answer, drag the appropriate values to the correct targets. Each value may be used once, more than once, or not at all. You may need to drag the split bar between panes or scroll to view content.
NOTE: Each correct selection is worth one point.
What is the minimum number of datasets and storage modes required to support the reports?
Which two types of visualizations can be used in the balance sheet reports to meet the reporting goals? Each correct answer presents part of the solution.
NOTE: Each correct selection is worth one point.
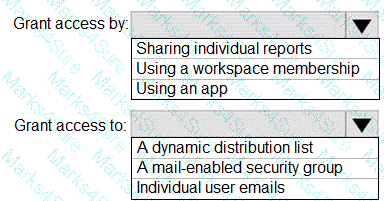
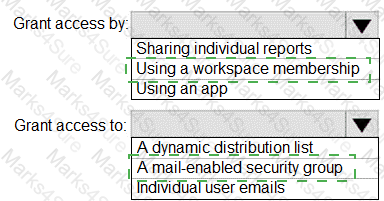
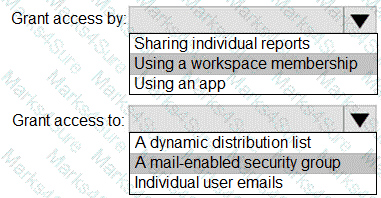
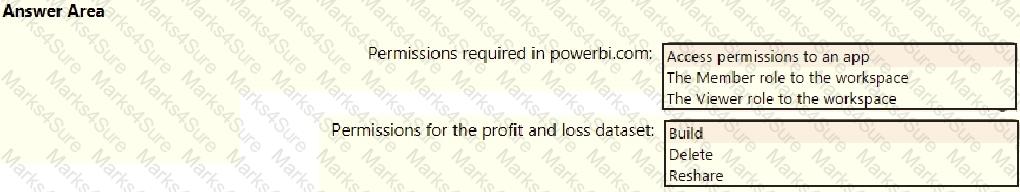
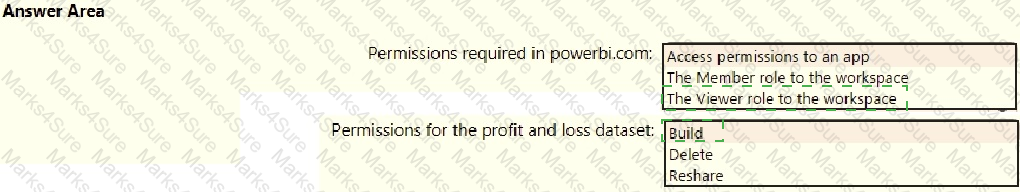
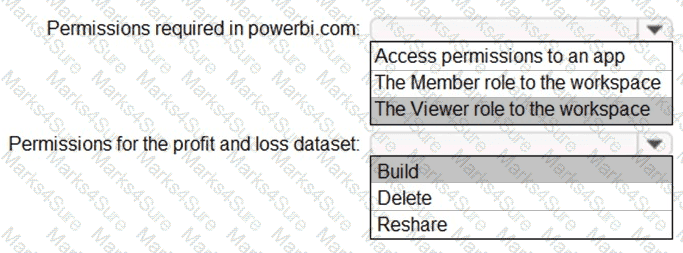
You need to grant access to the business unit analysts.
What should you configure? To answer, select the appropriate options in the answer area.
NOTE: Each correct selection is worth one point.
You have two tables named Customers and Invoice in a Power BI model. The Customers table contains the following fields:
CustomerID
Customer City
Customer State
Customer Name
Customer Address 1
Customer Address 2
Customer Postal Code
The Invoice table contains the following fields:
Order ID
Invoice ID
Invoice Date
Customer ID
Total Amount
Total Item Count
The Customers table is related to the Invoice table through the Customer ID columns. A customer can have many invoices within one month.
The Power BI model must provide the following information:
The number of customers invoiced in each state last month
The average invoice amount per customer in each postal code
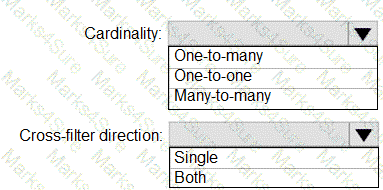
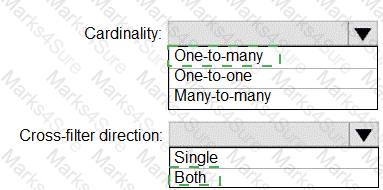
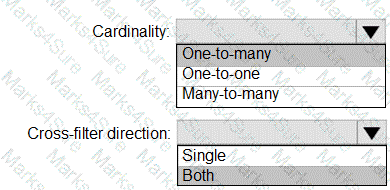
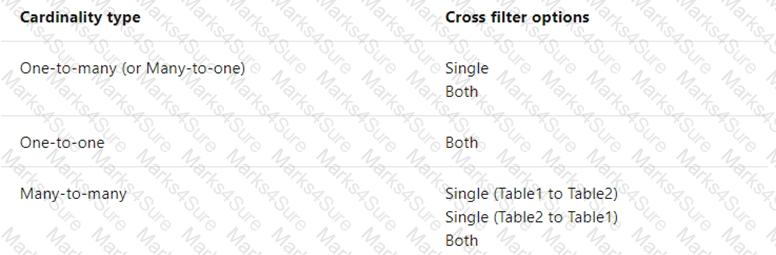
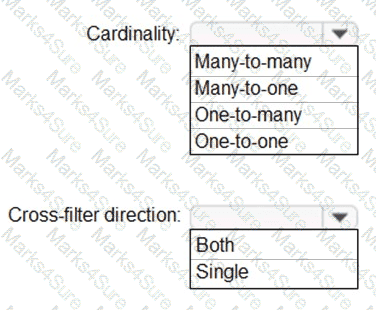
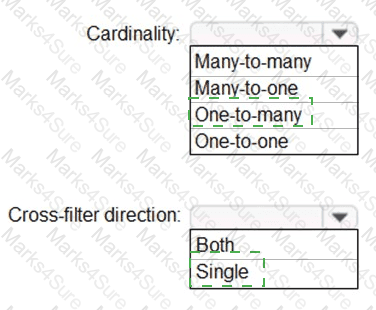
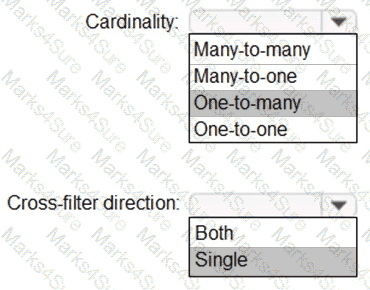
You need to define the relationship from the Customers table to the Invoice table. The solution must optimize query performance.
What should you configure? To answer, select the appropriate options in the answer area.
NOTE: Each correct selection is worth one point.
You have a Power B1 report that contains a card. The card displays the value for year-to-date revenue.
You need to ensure that screen reader users can read the value when initially interacting with the card. The value must stay updated as the dataset is refreshed.
What should you do?
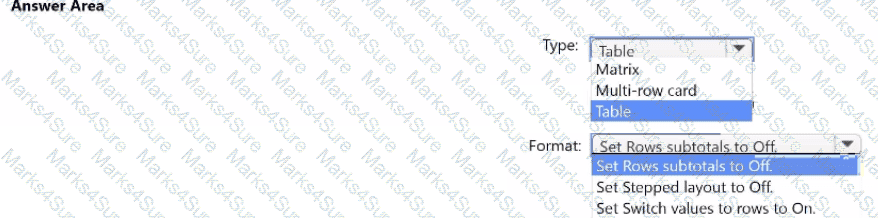
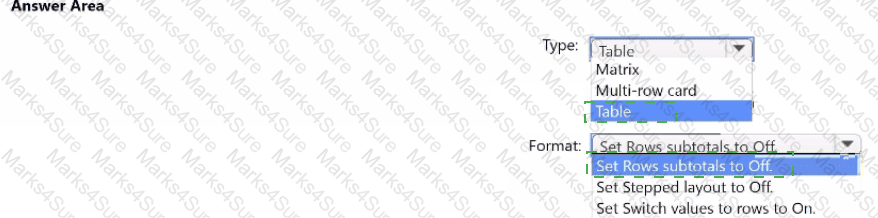
You have a Power B1 report that contains the table visual shown in the following exhibit.
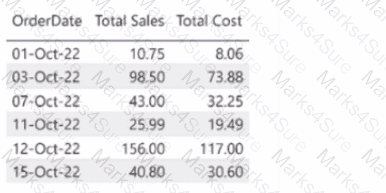
You need to modify the visual to display as shown in the following exhibit.

How should you configure the visual? To answer, select the appropriate options in the answer area.
NOTE: Each correct selection is worth one point.
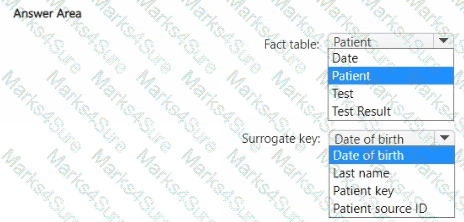
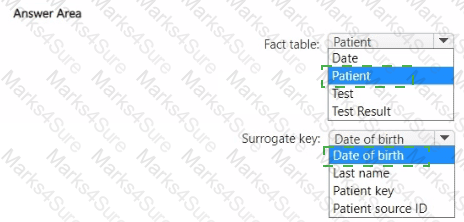
You are designing the data model for a Power Bl semantic model. You have the following tables in the star schema.
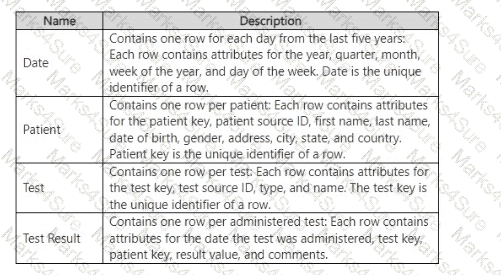
Which table is the fact table of the star schema, and which column in the Patient table is the surrogate key of the star schema? To answer, select the appropriate options in the answer area.
NOTE: Each correct selection is worth one point.
You need to create a Power BI theme that will be used in multiple reports. The theme will include corporate branding for font size, color, and bar chart formatting.
What should you do?
You have a Power BI dashboard that displays different visualizations of company sales.
You enable Q & A on the dashboard.
You need to provide users with sample questions that they can ask when using Q & A.
Which settings should you modify from the Power BI Settings?
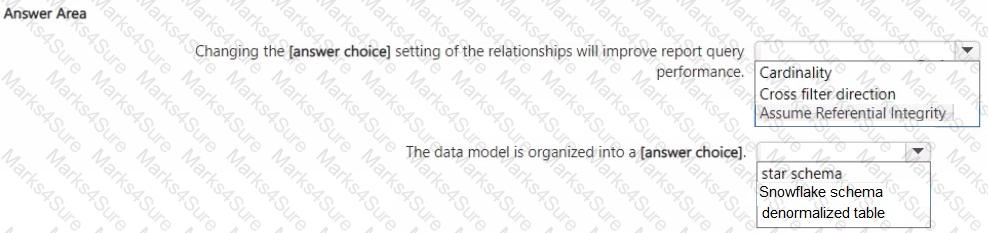
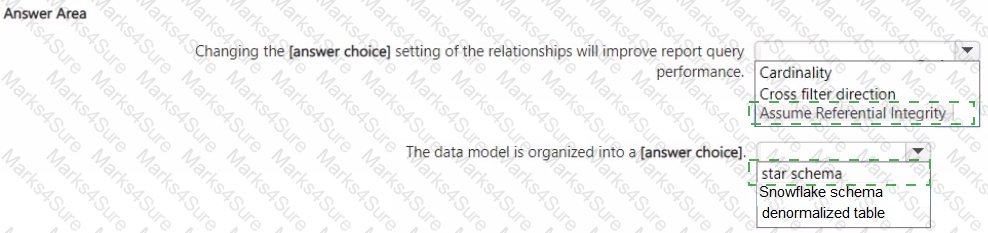
You have a semantic model in import mode that contains the model shown in the following exhibit.
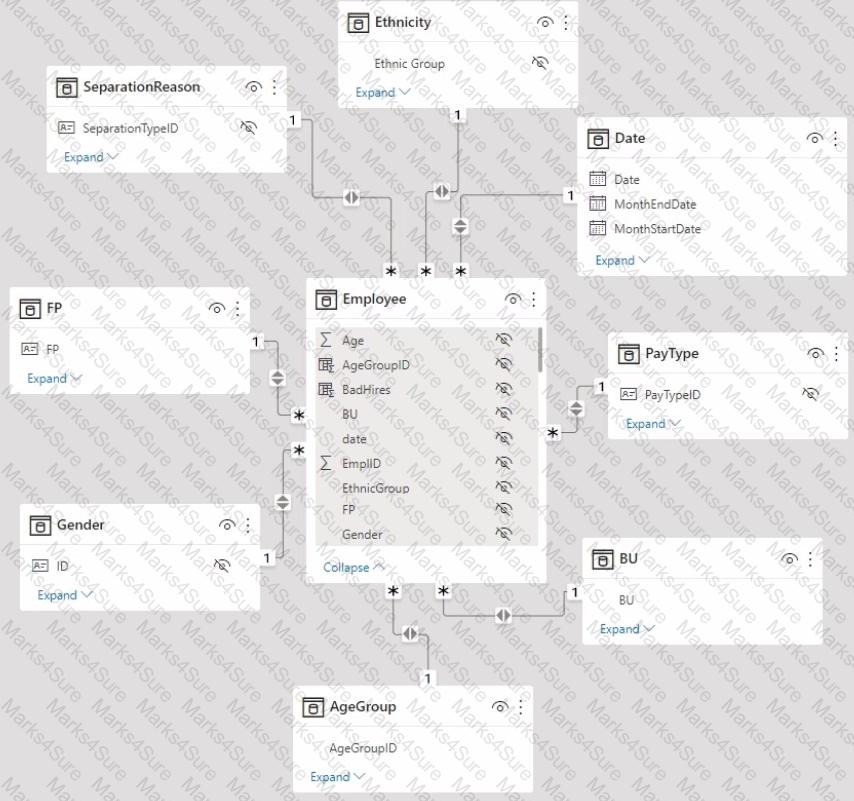
Use the drop-down menus to select the answer choice that completes each statement based on the information presented in the graphic.
NOTE: Each correct selection is worth one point.
ion have a Power BI dataset that contains a table named Temperature Readings. Temperature Readings contains the columns shown in the following table.
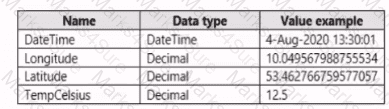
The table has 12 million rows. All the columns are needed for analysis.
You need to optimize the dataset to decrease the model size. The solution must not affect the precision of the data.
What should you do?
A user creates a Power B1 report named ReportA that uses a custom theme
You create a dashboard named DashboardA.
You need to ensure that DashboardA uses the custom theme. The solution must minimize development effort.
Which two actions should you perform? Each correct answer presents part of the solution.
NOTE: Each correct selection is worth one point.
You import a large dataset to Power Query Editor.
You need to identify whether a column contains only unique values.
Which two Data Preview options can you use? Each correct answer presents a complete solution.
NOTE: Each correct selection is worth one point
For the sales department at your company, you publish a Power Bl report and a semantic model that imports data from a Microsoft Excel file located in a Microsoft SharePoint folder. The semantic model contains several measures.
You need to create a new Power Bl report from the existing data that will use many of the measures created in the initial Power Bl semantic model. The solution must minimize development effort.
Which type of data source should you use?
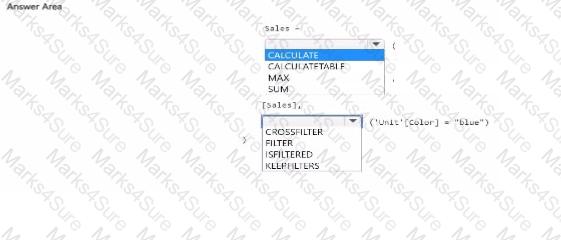
You have a Power BI semantic model named Model1.
You need to create a measure that will display the sales result for all units. The solution must maintain the existing filter.
How should you complete the DAX expression? TO answer, select the appropriate options in the answer area.
NOTE: Each correct selection is worth one point.

You have a Power Bl model that contains two tables named Population and Date.
The Population table contains two columns named Population Amount and Date Key.
DateKey contains date values that represent the first day of a year and are used to create a many-to
The Power Bl model contains two measures that have the following definitions.
Total Population = Sum ( ' Population ' [Population Amount])
2023 Population = CALCULATE ([Total Population] " Date ' [Year] = 2023)
You create a table visual that displays Date[Year] and [2023 Population] .
What will the table visual show?
Vow have a Power B1 semantic model named Modell that runs in Import storage mode. Vou need to reduce the size of Model 1. The solution must NOT increase report query response times. What should you do?
You have a Power B1 report that contains the visuals shown in the following table.
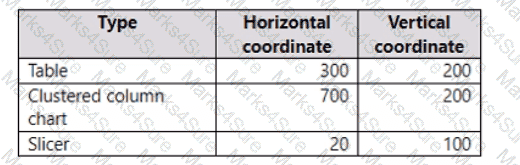
You need to modify the location of each visual.
What should you modify for each visual?
You have sales data in a star schema that contains four tables named Sales, Customer, Date, and Product.
The Sales table contains purchase and ship dates.
Most often, you will use the purchase date to analyze the data, but you will analyze the data by both dates independently and together.
You need to design an imported dataset to support the analysis. The solution must minimize the model size and the number of queries against the data source.
Which data modeling design should you use?
UESTION NO: 7
You have a report that contains a bar chart and a column chart. The bar chart shows customer count by
customer segment. The column chart shows sales by month.
You need to ensure that when a segment is selected in the bar chart, you see which portion of the total sales for the month belongs to the customer segment.
How should the visual interactions be set on the column chart when the bar chart is selected?
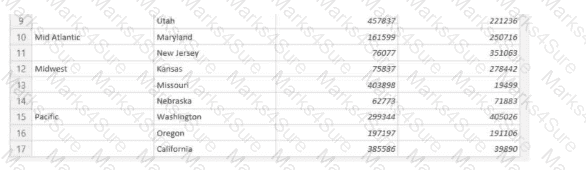
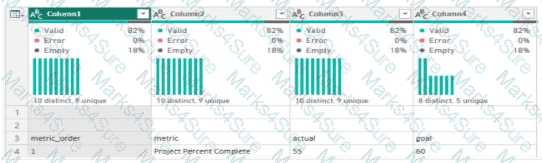
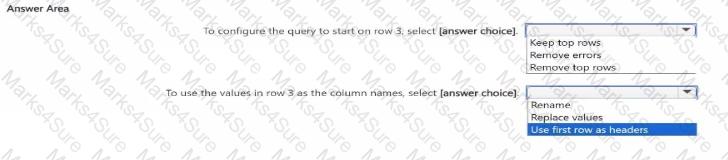
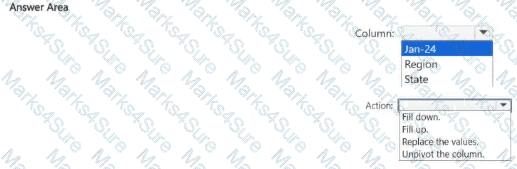
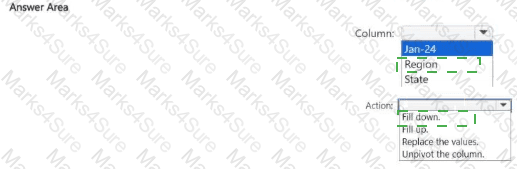
Each Region value appears only on the tow where it first occurred. Each subsequent occurrence of the Region value is blank.
You need to ensure that every row contains the connect non-blank value The solution must minimize development effort.
Which column should you select, and which action should you perform on the column? To answer, select the appropriate options in the answer area. NOTE; Each connect selection is worth one point.
You have a Power BI report that contains four pages.
All the pages contain a slicer for a field named Country,
You need to ensure that when a user selects a county on page l, the selection is retained on page 2 and page 3. The solution must prevent page 4 from being affected by
selections on the other pages,
What should you do?
Note: This question is part of a series of questions that present the same scenario. Each question in the series contains a unique solution that might meet the stated goals. Some question sets might have more than one correct solution, while others might not have a correct solution.
After you answer a question in this section, you will NOT be able to return to it. As a result, these questions will not appear in the review screen.
You are modeling data by using Microsoft Power Bl. Part of the data model is a large Microsoft SQL Server table named Order that has more than 100 million records.
During the development process, you need to import a sample of the data from the Order table.
Solution: You add a WHERE clause to the SQL statement.
Does this meet the goal?
PDF + Testing Engine

Testing Engine
PDF (Q&A)