Free Practice Questions for the Qlik Sense Business Analyst QSBA2021 Exam (2026 Updated)
At Marks4sure, we are dedicated to providing IT professionals with the most accurate and reliable preparation materials for the Qlik QSBA2021 exam. To support your certification journey, we have made a selection of our premium 2026 Qlik Sense Business Analyst practice questions and answers available completely free. You can take this practice test as many times as you need. Every question includes a detailed, expertly verified explanation to ensure you fully grasp the core security concepts before test day.
To improve efficiencies a hospital must analyze how often a surgery is started late by operating room and surgeon The business analyst must consider several factors
• Dates of each surgery
• Number of minutes the start of the surgery is delayed
• Operating room
• Surgeon name
Which visualization should the business analyst use to meet these requirements?
A company CEO requests a dashboard that easily displays provides understating and tracks company performance. There are several ma n dashboard requirements:
• Viewable by a mobile device
• Display multiple key measures
• Provide ability to easily navigate to other sheets
Which feature meets these requirements?
A finance manager uses an Excel file to record travel expenses The file has historical data and is used m multiple Qlik Sense apps The finance manager needs to deploy only the past three months of data to the regional sales managers
Which solution should be used to meet the requirements using the data manager?
A company CEO requests an app that contains global sales information. The CEO needs to present this information to an audience of international investors during an upcoming meeting
The presentation must meet several requirements
• Contain visualizations that present dearly to a large audience
• Answer audience questions dynamically
• Be made available as shared content
• Emphasize important sales revenue
Which Qlik Sense features must the business analyst prepare?
A business analyst wants to create a dashboard for the Finance team to use The app must include four sheets one looking at the full dataset and three others focused on the regions APAC EMEA and AMERICAS each.
The team needs visualizations for
• Sales by Product in the past 6" months
• Cost of Sales on a map by Country
• Sales Cost and Margin by Month
Additionally the learn wants to dear fillers while navigating between sheets and enable chat in the hub Which features should be used?
A business analyst is creating an app for the sales department
Users of the app most be able to create sheets and analyze data The sales department has several additional requirements
• Reuse the global sales visualization
• Create new visualizations
• The app has over 100 visualizations
Users will NOT have access to the full data model
What should be added to the master items to meet the requirement?
A business analyst using a shared folder mapped to S \419379942\ receives an Excel We with more than 100 columns Many of the columns are duplicates. The current set of columns mat should be used have the suffix '_c* appended to the column name
What should the business analyst do to load the Excel data?
A business analyst inherits an app full of sheets The business analyst needs to redesign the app using the DAR principle How should the business analyst order the visualizations?
A business analyst is creating a new app with sales data. The visualizations must meet several requirements:
• A Bar chart mat shows sales by product group is used m multiple sheets
• A KPI object that visualizes that the total amount of sales is used once
• A Treemap mat shows margin by product group is used one time inside a Container
What should be added to the master items library?
A business analyst is designing a business intelligence solution to track production. There are several requirements in the complicated factory environment
• Printed work summary documents produced daily
• Information monitors that show custom website with visualizations from QIA Sense
• Ability to calculate the shortest routes between two sets of coordinates
Which three options are needed to meet these requirements? (Select three)
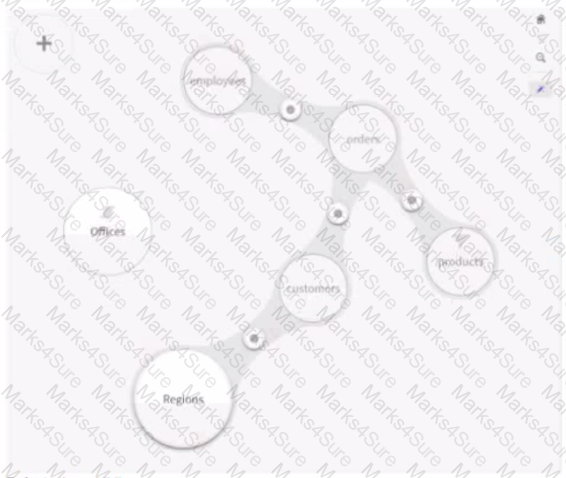
Refer of the exhibit.
A business analyst needs to add a table and make sure it is associated appropriately. The table contains regional information about employee offices and must be able to titer the orders by employee office.
Which steps should the business analyst take?
A customer wants to perform a regional sates analysis to learn how products set over time m different areas The business analyst needs to design a sheet in the app tor business users to perform several tasks
• Select two different groups of countries to study
• Compare sales over time between these two groups using a bar chart
• Change the group items by selecting different countries at any time
• Select a time range in the bar chart and drill-down to daily transactional sales
Which steps should the business anaryst follow to meet these requirements?
PDF + Testing Engine

Testing Engine
PDF (Q&A)