Free Practice Questions for the Qlik Sense Business Analyst QSBA2022 Exam (2026 Updated)
At Marks4sure, we are dedicated to providing IT professionals with the most accurate and reliable preparation materials for the Qlik QSBA2022 exam. To support your certification journey, we have made a selection of our premium 2026 Qlik Sense Business Analyst practice questions and answers available completely free. You can take this practice test as many times as you need. Every question includes a detailed, expertly verified explanation to ensure you fully grasp the core security concepts before test day.
In the 'Sales By Product' bar chart, a customer wants to highlight a specific product bar that includes a dynamic label. The label will only be visible when conditions are met. Which feature should the business analyst add to the bar chart?
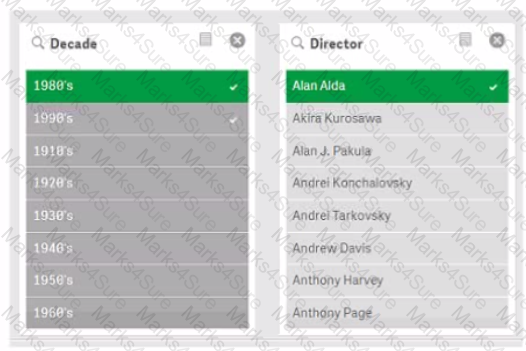
A business analyst receives multiple requests for a variety of different filter panes to be placed on a dashboard. Users need to filter on many different values across different fields.
Which Qlik Sense feature do the users need to learn about to meet their needs?
A customer needs to demonstrate the value of sales for each month of the year with a rolling 3-month summary. Which visualization should the business analyst recommend to meet the customer's needs?
Two customers in an organization want to use an app that contains a finance data set. With different analysis objectives, each customer will only use a subset of that data. Which procedure should the business analyst follow?
A business analyst from the APAC region is creating a single KPI object for that region.
The analyst must meet the following requirements:
• The KPI should show a total of sales
• The business wants to compare current year (CY) vs last year (LY) sales
• The KPI should not change if the user makes selections
Which measure(s) will allow the KPI object to fulfill this requirement?
A)

B)

C)

D)

A company CFO has requested an app that contains visualizations applicable to analyzing the finance data. Each regional finance team will analyze their data and should only have access to the data in their region. The app must contain a high-level sheet that navigates to relevant detail sheets.
Which features support a logical design structure?
Refer to the exhibit.
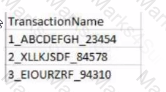
The users of a Qlik Sense app report slow performance. The app contains approximately 10 million rows of data. The business analyst notices the following KPI master measure definition:
Left{ Trim( TransactionName), 1 ) * Right ( TransactionName, 5) Which steps should the business analyst complete to improve app performance?
A company has sales data where every Customer ID can be assigned to one or more Sales Account ID. Sales Accounts are assigned to one of eight Groups. The business analyst is creating an app with the following requirements:
• Each Group should have a separate sheet
• The Sales Account can only see its own customers
• The Sales Account can navigate only to the sheet for the Group assigned
The business analyst has created a Section Access table, in which each Sales Account ID is assigned their CustomerlDs. Which action should the business analyst take next?
A business analyst created a visualization that has a color indicator when an order is below a certain fixed profit threshold. This visualization now needs to change so that the threshold can be defined by the user. The user base is approximately 1000 heavy Excel users. These thresholds will be defined by each user somewhat frequently, although the data changes only once per day.
Which action should the business analyst take to update this visualization?
A business analyst has access to all of a company's data for the past 10 years. The source table consists of the following fields: TransactionID, TransactionTime, Transaction Date, Transaction Year, Cardholder, Cardholder address, Cardissuer, and Amount.
Users request to create an app based on this source with the following requirements:
• Users only review the data for the past 2 years
• Data must be updated daily
• Users should not view cardholder info
Which steps should the business analyst complete to improve the app performance?
A business analyst is creating an app that contains a bar chart showing the top-selling product categories. The users must be able to control the number of product categories shown.
Which action should the business analyst take?
A business analyst is developing an app that contains a data model with fields: Country, City, Sales, ProductName, and ProductCategory. The global sales manager wants to add new visualizations to this app.
The business analyst must include the following:
• Ability to dynamically change the number of countries and cities
• Display a maximum of 10 countries
• Display a maximum of 5 cities per country
Which steps should the business analyst take?
A business analyst is creating an app that requires several visualizations
• A scatter plot mat shows the margin percentage and total sales by product category
• A map with a the layer that visualizes lines between retail stores and lactones
• A KPI that shows total cost
Margin% can be calculated by dividing profit by revenue Profit is the difference between total cost and total sates
Which two sets of fields can the business analyst use to meet these requirements? (Select two.)
A business analyst must add data from several tables to an existing app This app was built by a previous business analyst who used the data load editor to load some simple tables.
The changes must be implemented in the data manager
Which three actions should the business analyst take to matt these requirements? (Select three )
The sales manager is investigating the relationship between Sales and Margin to determine if this relationship is linear when choosing the dimension Customer or Product Category
The sales manager wants to have the potential percentage Sales tor each Stage (initial to Won) of the sales process
What are the two correct visualizations?
A company installs Qlik Sense on Windows without any additional visualization bungles A business analyst must create an app with three sheets
• Sheet 1 KPIs and sales trends for the past 12 months
• Sheet 2 Regional sales by representative
• Sheet 3 Sales by country displayed in a map
Users must be able to view all of the sheets and make selections for their analyses.
Which three objects should be added to the three sheets? (Select three)
An organization recently acquired a competitor A business analyst needs to merge me custom databases with 20 years of customer and order transactions. The data must be integrated into the existing app to show the past two years of data Performance degradation must be minimized
What should the business analyst do to meet this requirement?
A sales manager needs to visualize the company's sales. The sales manager needs to understand how sates and profitability are related over time. The visualization will be used in a printed annual report.
The business analyst has access to the following data:
• Order Dates
• Order ID
• Total Safes by Order
• Net profit margin%
• Cost of Goods Sow (COGS)
Which visualization should the business analyst use?
A user makes a selection within a sheet and then navigates to another sheet to validate the details However when the user returns to the original sheet the selection is removed What is causing this behavior?
A business analyst has access to all of a company's data tor the past 10 years The source table consists of the following fields Transactions Transaction Time Transaction Date Transaction Year Cardholder Cardholder address Cardissuer and Amount Users request to create an app based on this source
Users only review me data for the past 2 years Data must be updated daily Users do not view cardholder into
What should the business analyst do to reprove the app performance?
A business analyst s developing an app 10 track the influence of the company's mascot cat on instagram The marketing department has several requirements for this solution.
• Information must be updated every hour to the company's information monitor
• Data from Instagram must be fetched over a REST connection and combined with Google Analytics data
• There must be a way to visualize changes of followers *i a map
Which two features are needed to meet these requirements? (Select two.)
A company that manages several tennis clubs uses an app mat includes three master measures TotalCost, Totallncome. and TotalMargin A business analyst needs to create a new table that utilizes master items and meets the following requirements:
• Number of bookings that users make
• Cost associated with booking (including electricity and indirect costs)
• Income obtained and profit originated m each booking
• Sales margin: percentage of margin over income
• Detail by tennis clubs
Which optimal expressions should the business analyst use?
A business analyst is creating a story One visualization must be scaled only vertically. Which steps are needed to apply this in the storytelling view?
Several departments use an app. The business analyst needs to modify access to the sheets so that each department can access their sheets only What should me business analyst do?
A business analyst wants to create a dashboard for the Finance team to use The app must include four sheets one looking at the full dataset and three others focused on the regions APAC EMEA and AMERICAS each.
The team needs visualizations for
• Sales by Product in the past 6" months
• Cost of Sales on a map by Country
• Sales Cost and Margin by Month
Additionally the learn wants to dear fillers while navigating between sheets and enable chat in the hub Which features should be used?
A Help Desk department sets a first-time fix target of 65% for ail customer calls. The department has a measure that captures the actual first-time fix percentage. A business analyst needs to choose the visualization that most effectively shows the performance against the target using a color gradient Which visualization should the business analyst use?
PDF + Testing Engine

Testing Engine
PDF (Q&A)