Free Practice Questions for the Qlik Sense Business Analyst QSBA2024 Exam (2026 Updated)
At Marks4sure, we are dedicated to providing IT professionals with the most accurate and reliable preparation materials for the Qlik QSBA2024 exam. To support your certification journey, we have made a selection of our premium 2026 Qlik Sense Business Analyst practice questions and answers available completely free. You can take this practice test as many times as you need. Every question includes a detailed, expertly verified explanation to ensure you fully grasp the core security concepts before test day.
Refer to the exhibit.
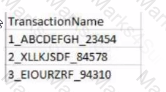
The users of a Qlik Sense app report slow performance. The app contains approximately 10 million rows of data. The business analyst notices the following KPI master measure definition:
Left{ Trim( TransactionName), 1 ) * Right ( TransactionName, 5) Which steps should the business analyst complete to improve app performance?
The VP of Finance is requesting a presentable solution that allows them to share finance information in monthly meetings with C-suite executives. Given the monthly meeting agendas, the solution must be customizable.
Which Qlik Sense feature should be implemented to meet this requirement?
A company CEO requests an app that contains global sales information. The CEO needs to present this information to an audience of international investors during an upcoming meeting.
The presentation must meet several requirements:
• Contain visualizations that present clearly to a large audience
• Answer audience questions dynamically
• Be made available as shared content
• Emphasize important sales revenue
Which Qlik Sense features should the business analyst prepare?
A banking organization needs a dashboard that shows the following:
• A KPI indicator for current year (CY) versus last year (LY) revenue
• A scatter plot that shows the cost versus revenue of product categories
• A treemap that shows average customer satisfaction rating based on regions
• A table that shows CY cost by record number, financial instrument, and bank
In addition to the customer satisfaction rating, which fields should be used to create the required measures?
The sales manager is investigating the relationship between Sales and Margin to determine if this relationship is linear when choosing the dimension Customer or Product Category.
The sales manager wants to have the potential percentage Sales for each Stage (Initial to Won) of the sales process.
Which visualizations will meet these requirements?
A business analyst needs to rapidly prototype an application design for a prospective customer. The only dataset provided by the customer contains 30 fields, but has over one billion rows. It will take too long to keep loading in its entirety while the analyst develops the data model.
Which action should the business analyst complete in the Data manager?
A business analyst has access to all of a company's data for the past 10 years. The source table consists of the following fields: TransactionID, TransactionTime, Transaction Date, Transaction Year, Cardholder, Cardholder address, Cardissuer, and Amount.
Users request to create an app based on this source with the following requirements:
• Users only review the data for the past 2 years
• Data must be updated daily
• Users should not view cardholder info
Which steps should the business analyst complete to improve the app performance?
In the 'Sales By Product' bar chart, a customer wants to highlight a specific product bar that includes a dynamic label. The label will only be visible when conditions are met. Which feature should the business analyst add to the bar chart?
Refer to the exhibit.
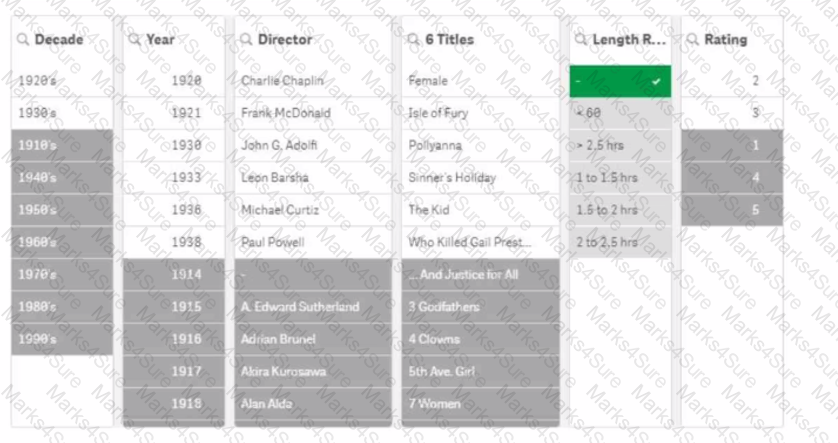
A movie analyst is using an app to gain insights into films created in the early 20th century. The analyst reviews the filter for Length Range, notices a hyphen "-", and selects it.
What can the analyst determine from the resulting filter panes?
Exhibit.
Refer to the exhibit.
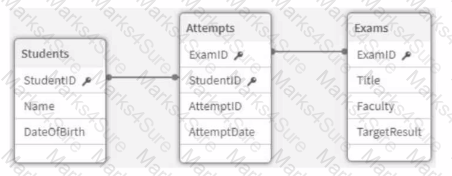
An app is being developed at a university to monitor student exam attempts- Three core tables are loaded into the app for Students, Exams, and Attempts. Students can attempt the same exam multiple times.
Before building any visualizations, the business analyst needs to know:
• How many students are in the system
• What percentage of students have not yet attempted an exam
Which metadata should the analyst focus on to answer these questions?
The business analyst creates one table by concatenating and joining several source tables. This has resulted in a table of several thousand rows that may have several columns containing between 30% and 70% null values. The business analyst needs to understand the level of null values in each field of this table to determine if this is an issue.
Which capability should the business analyst use?
The CEO has requested a dashboard that tracks the company's performance. The main requirements for the dashboard:
• Minimal number of visualizations or objects
• Display multiple key measures
• Ability to easily navigate to other sheets
Which features would meet the requirements?
PDF + Testing Engine

Testing Engine
PDF (Q&A)