Free Practice Questions for the Tableau Certified Data Analyst TDA-C01 Exam (2026 Updated)
At Marks4sure, we are dedicated to providing IT professionals with the most accurate and reliable preparation materials for the Tableau TDA-C01 exam. To support your certification journey, we have made a selection of our premium 2026 Tableau Certified Data Analyst practice questions and answers available completely free. You can take this practice test as many times as you need. Every question includes a detailed, expertly verified explanation to ensure you fully grasp the core security concepts before test day.
A colleague provides you with access to a folder that contains the following files:
• Sates.csv
• Bookl.twb
• Sates.hyper
• Export.mdb
Which He contains an extract?
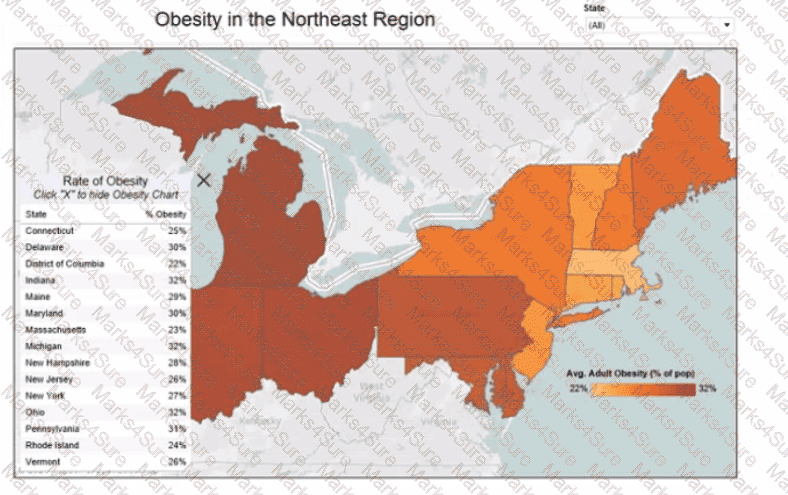
You have the following box plot that shows the distribution of average profits made in every state by region.
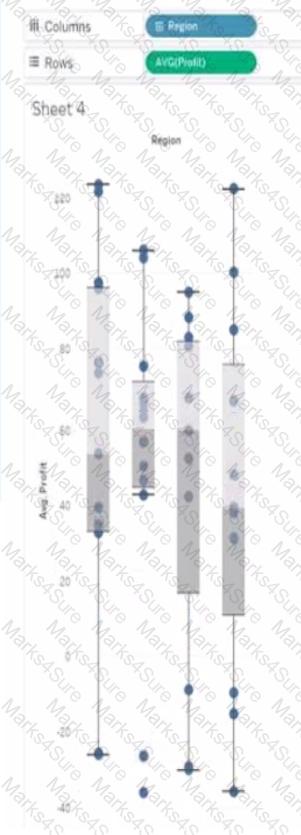
Which region has the smallest distribution of profits?
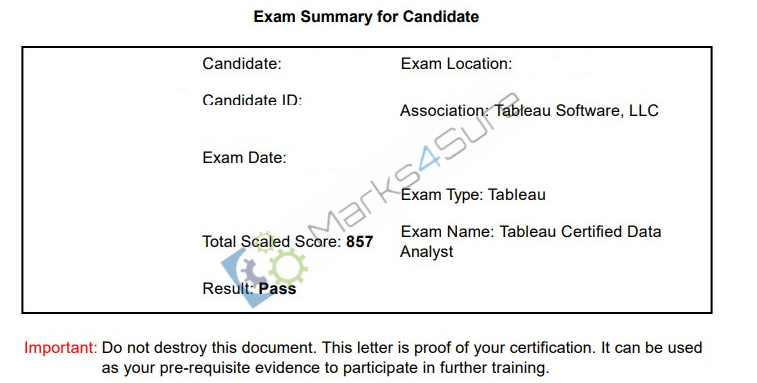
TDA-C01 Report Card
A Data Analyst at a coffee company has the following visualization already built.
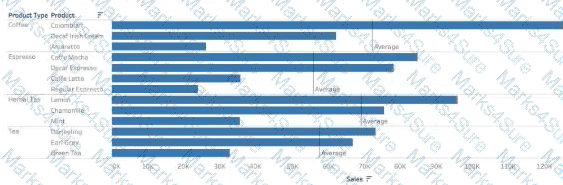
The analyst wants to make this more visually appealing by coloring the bars based on whether they are above or below the Average Sales within each Product Type.
Which calculation should the analyst use to calculate the Average Sales for each Product Type?
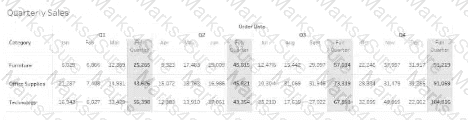
Which option must a Data Analyst enable to build the following table to add quarterly totals?
You have the following dataset.
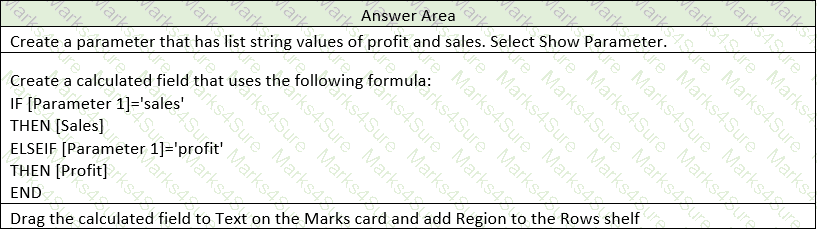
You need to create the following worksheet.
The table must show either profit or sales based on the selection from the Parameter 1 menu.
Which three actions should you perform in orders
(Place the three correct options in order Use the arrows to move Options lo Answer Area Use Answer Area arrows to reorder the options)
 A screenshot of a computer
Description automatically generated
A screenshot of a computer
Description automatically generatedYou want to connect a Tableau workbook to a dataset in a Microsoft Excel spreadsheet.
What should you do from Tableau Desktop?
You have the following chart that sorts states by the number of products each state has purchased.
Which formula should you use to include a number with the position of each state within each region?
You publish a dashboard tut uses an attract. The extract refreshes every Monday at 10:00.
You need to ensure that the extract also refreshes on the last day of the month at 18:00.
What should you do?
You have the following tiled dashboard that has one sheet.
You want to replace the sheet with Sheet2.
What should you do?
You plan to create a visualization that has a dual axis chart. The dual axis chart will contain a shape chart and a line chart will use the same measure named Population on the axis.
You need to configure be shapes to be much larger than the line.
What should you do?
You have the following dataset.
Which Level of Detail (LOD) expression should you use to calculate tie grand total of all the regions?
You have a dashboard that contains confidential information about patients health. The data needs to always be up to date tor a team of healthcare workers How should you share me dashboard with the healthcare workers?
You have a line chart on a worksheet.
You want to add a comment to March 2020 as shown in the following visualization.
What should you do?
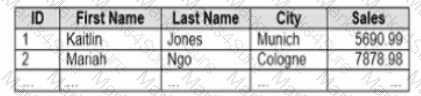
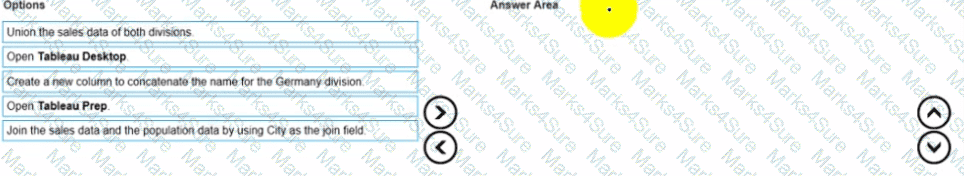
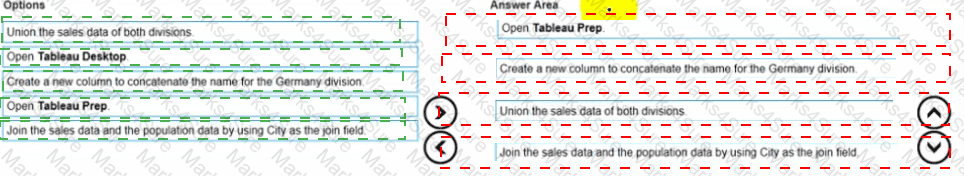
You company has two divisions located in the United States and Germany Bach division has a separate database. The following is a sample of the sales data for the division in the United States.
The following is a sample of the sales data for me division in Germany.
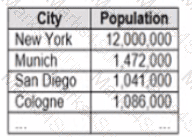
You have population data in a file named Populatio.csv. the following is a sample of the data.
You plan to create a visualization that ml show tie sales per capita for each salesperson Each salesperson must be identified by identified by their full name.
You need to prepare the data to support the planned visualization. The data source must support being published .
Which four actions should you perform in order?
(Place the four correct options n order Use the arrows to move Options to Answer Area arrows to re-order the options.
Use Answer Area arrows to re-order the options)
You have the following line chart that shows the average sales by month.
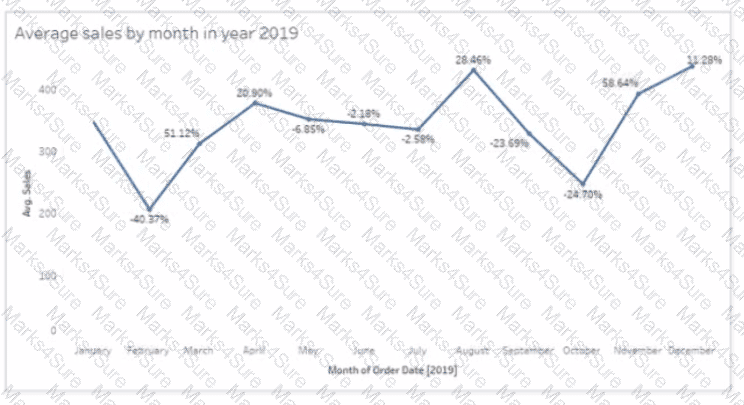
Which month had the biggest increase in swage sales compared to me previous month in 2019?
You have the following dashboard that contains two visualizations.
You want to show only one visualization at time. Users must be able to switch between visualizations.
What should you me?
You have the following data source in tableau Server.
You need to ensure that the data is updated every hour.
What should you select?
You are the owner of an alert.
You receive an email notification that the alert was suspended
From where can you resume the suspended alert?
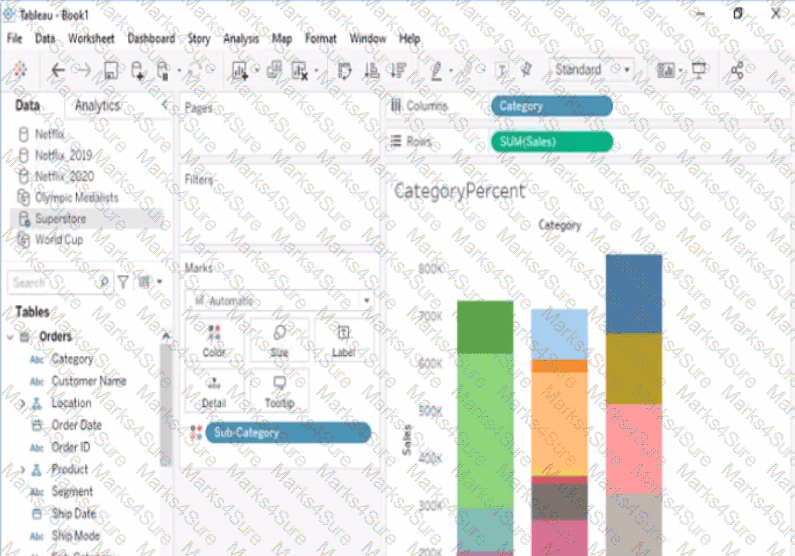
Open the link to Book1 found on the desktop. Open the CategoryPercentage worksheet.
Modify the bar chart show the percentage of sales for each Subcategory within every Category. The total percentage for every Category must be 100%.
Open the link to Book1 found on the desktop. Open the Line worksheet.
Modify the chart to show only main and max values of both measures in each region.
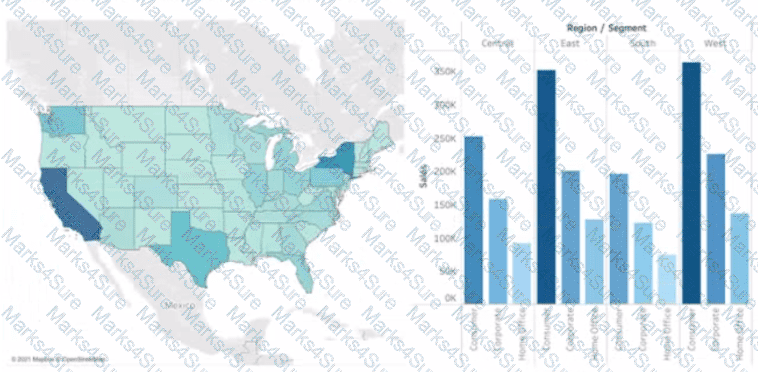
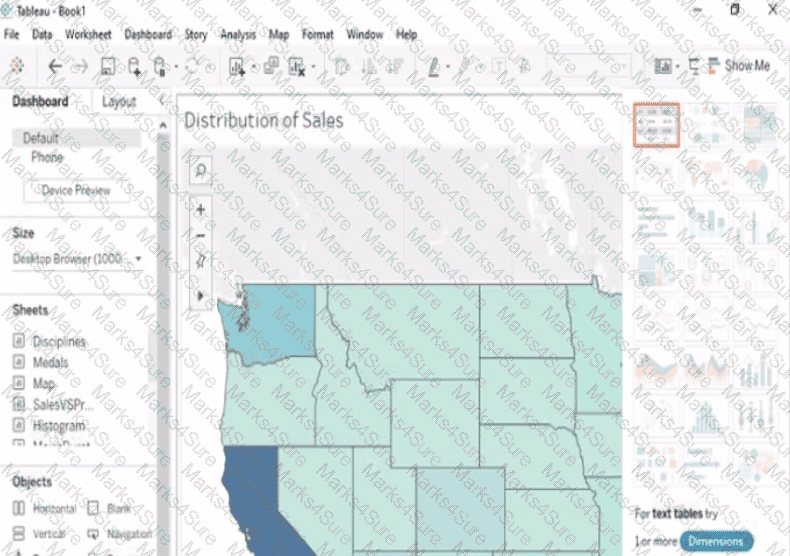
Open the Link to Book1 found on the desktop. Open Map worksheet and use Superstore data source.
Create a filed map to show the distribution of total Sales by State across the United States.
Open the link to Book1 found on the desktop. Open the Movie Durations worksheet.
Replace the existing data source with the Netflix_2019 data source.
Open the link to Book1 found on the desktop. Use the Superstore data source.
Split the Customer Name field into two fields named First Name and Last Name.
Open the link to Book1 found on the desktop. Open the Histogram worksheet and use the Superstone data source.
Create a histogram on the Quantity field by using bin size of 3.
Open the link to Book1 found on the desktop. Open the sales dashboard.
Add the Sales by State sheet in a Show/Hide button to the right side of the dashboard.
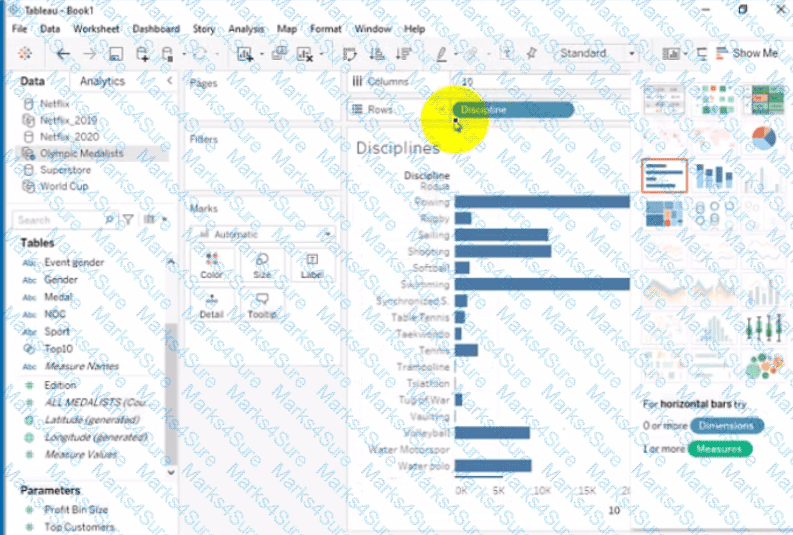
Open the link to Book1 found on the desktop. Open Disciplines worksheet.
Filter the table to show the Top 10 NOC based on the number of medals won.
Open the link to Book1 found on the desktop. Open Disciplines worksheet.
Filter the table to show the members of the Top10 set and the members of the Bottom10 set. There should be a total of 20 rows.
Open the link to Book1 found on the desktop. Open SalesVSProfit worksheet.
Add a distribution band on Profit to show the standard deviation from- 1 to 1.
You have the Mowing two tables that contains data about the books in a library.
Both tables are incomplete so there are books missing from the tables.
You need to combine the tables. The solution must ensure that all the data is retained
Which type of join should you use?
You have a data source that contains the following columns.
You want to filter regions based on the highest sales. Users must be able to specify the number of regions shown.
Which three actions should you perform in order? (Place the three correct options in order. Use the arrows to move Options to Answer Area.
Use Answer Area arrows to re-order the options.)
You create the following story that contains two story point.
You want to change the story point format to show the current story point number out of the total number of story points.
Which Layout option should you use?
PDF + Testing Engine

Testing Engine
PDF (Q&A)