Free Practice Questions for the Tableau Desktop Specialist TDS-C01 Exam (2026 Updated)
At Marks4sure, we are dedicated to providing IT professionals with the most accurate and reliable preparation materials for the Tableau TDS-C01 exam. To support your certification journey, we have made a selection of our premium 2026 Tableau Desktop Specialist practice questions and answers available completely free. You can take this practice test as many times as you need. Every question includes a detailed, expertly verified explanation to ensure you fully grasp the core security concepts before test day.
You have the following string value: Sales Data.
Which calculated field produces an output of Sales?
Our use case states that we need to create a set showing the Bottom 10 products by Profit in each Region. Which of the following filter types should you apply on Region?
Is it possible to deploy a URL action on a dashboard object to open a Web Page within a dashboard rather than opening the system’s web browser?
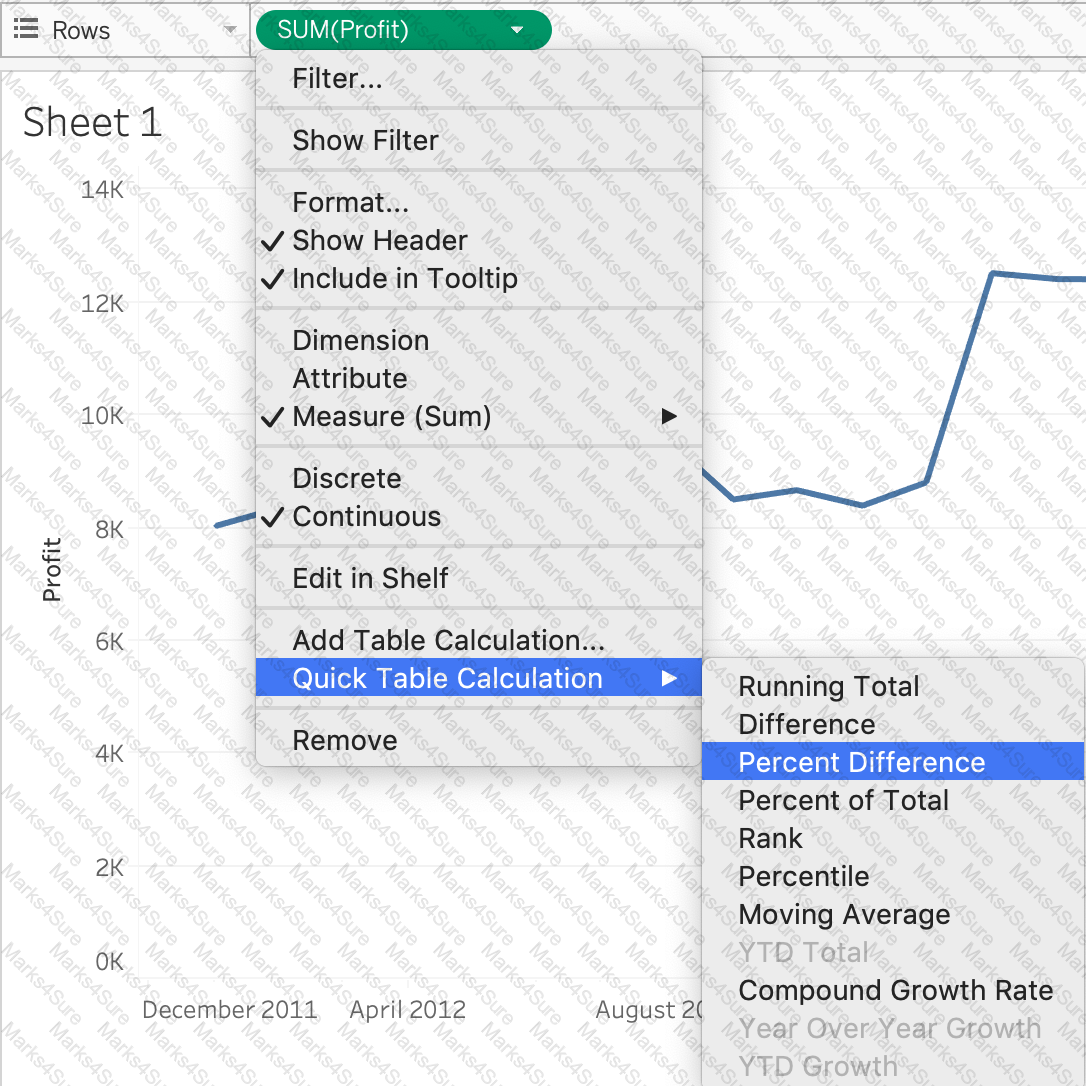
To use a quick table calculation, which of the following programming languages do you need to know?
By default, measures placed in a view are aggregated. The type of aggregation applied ______________
True or False: You get different filtering options for categorical and quantitative data

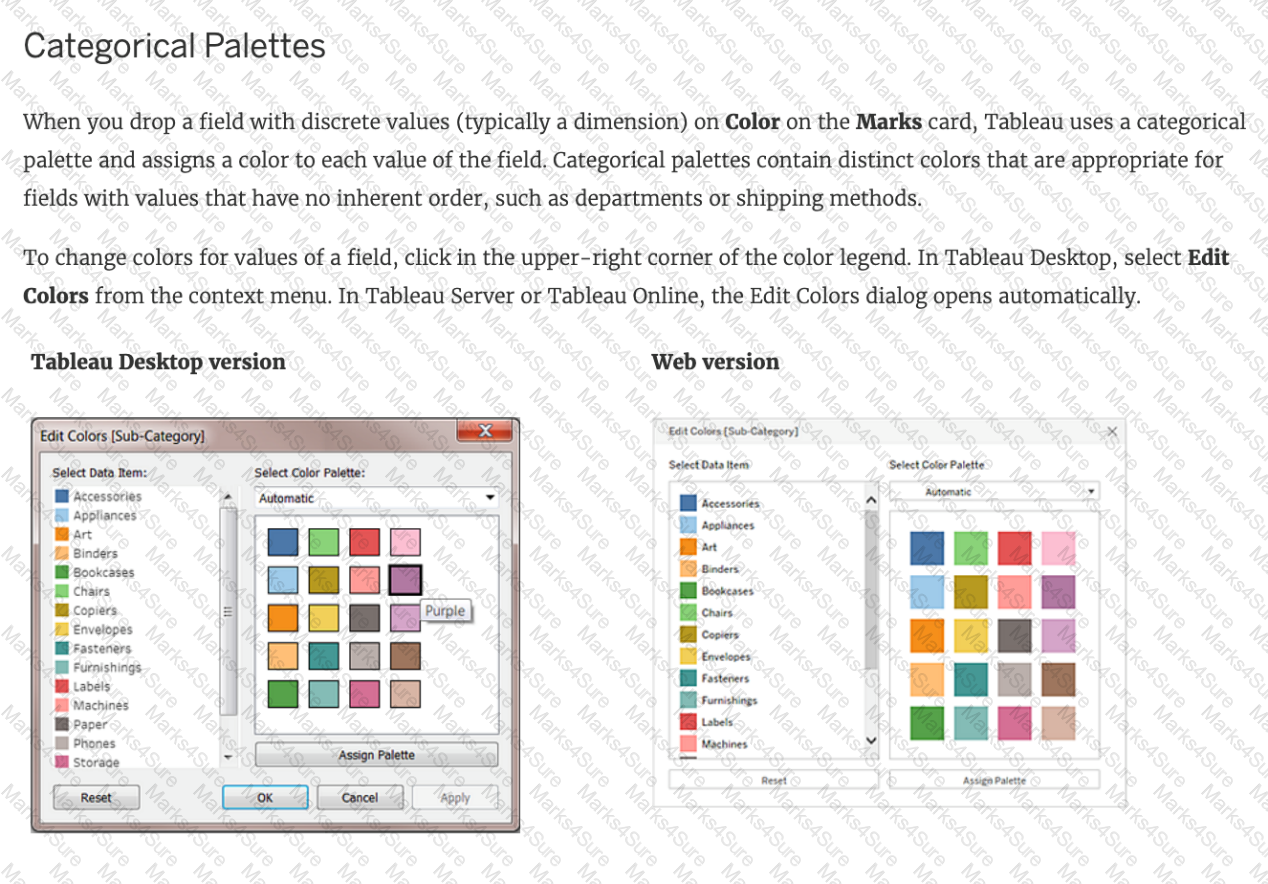
Dragging a ______________ to colour creates distinct colours for each item whereas dragging a ______________ to colour creates a gradient
To customize links based on the data in your dashboard, you can automatically enter field values as _______________ in URLs
Using the Time Series table, create a chart that shows the percent difference in Average Inventory on Hand for each Assortment by year and quarter.
How many quarters did the Electronics Assortment show a negative percent difference in the Average Inventory On Hand?
Which chart type uses automatically generated sizes that cannot be resized by using the Marks card?
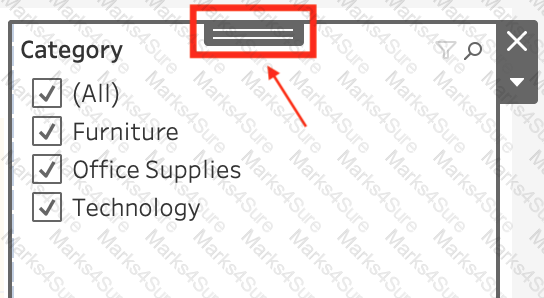
If you have a dashboard and are displaying its filter, how can you rearrange it?
You create a crosstab that shows a list of 100 hotel chains alongside their average nightly cost. You also create two groups showing, respectively, the top 10 and bottom 10 hotel chains by cost, with subtotals.
What should you do to improve the crosstab and compare the two groups to all the remaining hotel chains?
True or False: Enabling any other type of sort (Field, alphabetic, or Nested) clears the manual sort we create.
Using the CoffeeChain table, create a chart to see the monthly Percent difference change in Profit, from the beginning of 2012 to the end of 2013. How many months saw a Negative percent difference in Profit?
Using the Geo Data table, create a Bar chart showing the In-Stock percentage for each Color. What is the Average In-Stock percentage for the Color Red? Present your answer correctly upto 2 decimal places.

True or False: Physical tables remain distinct (normalized), not merged in the data source whereas logical tables are merged into a single, flat table.
Which of the following can help us focus on specific data without removing data in the visualization?
Which of the following is true about ' Incremental refresh ' when creating Extracts in Tableau?
_________________ are a local copy of a subset or entire data set that you can use to share data with others, when you need to work offline, and improve performance.
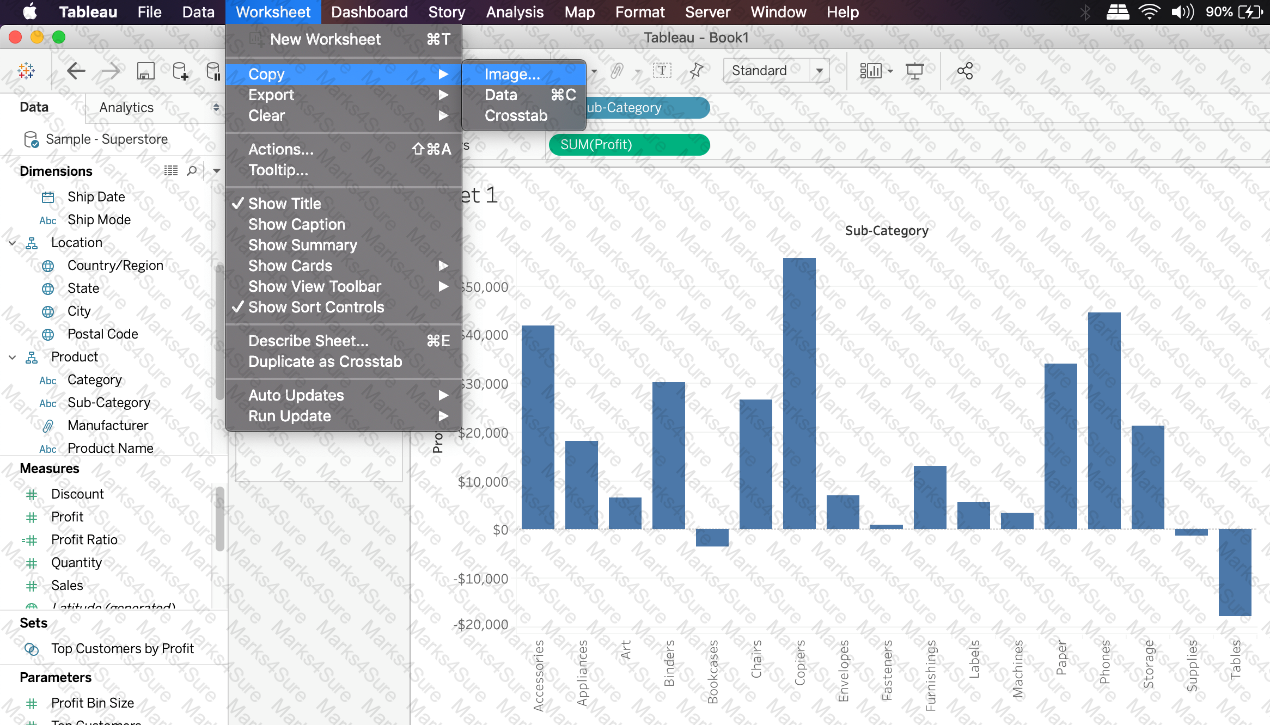
Which of the following are valid ways to copy a worksheet visualisation as an image?
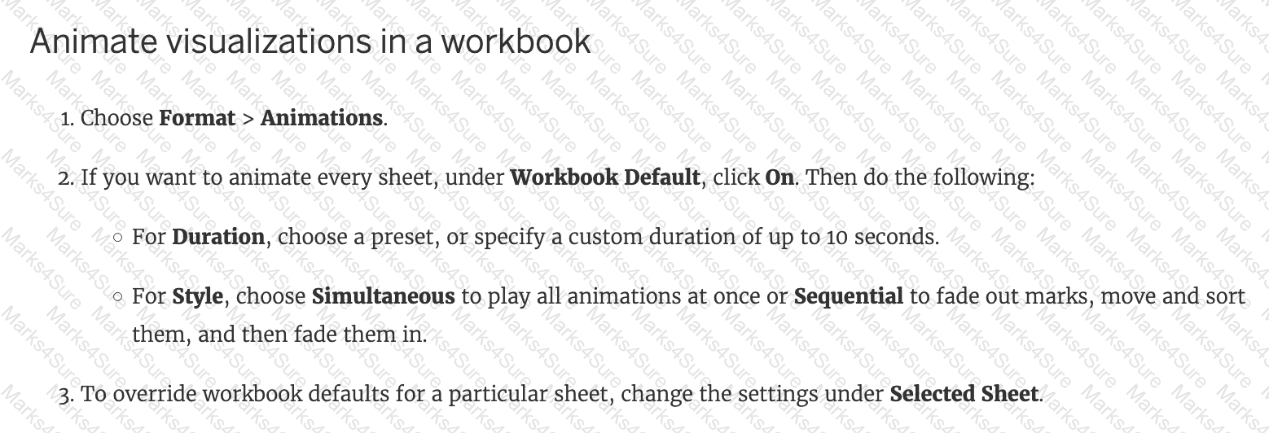
When using Animations in a Tableau, which of the following is the default duration for animations?
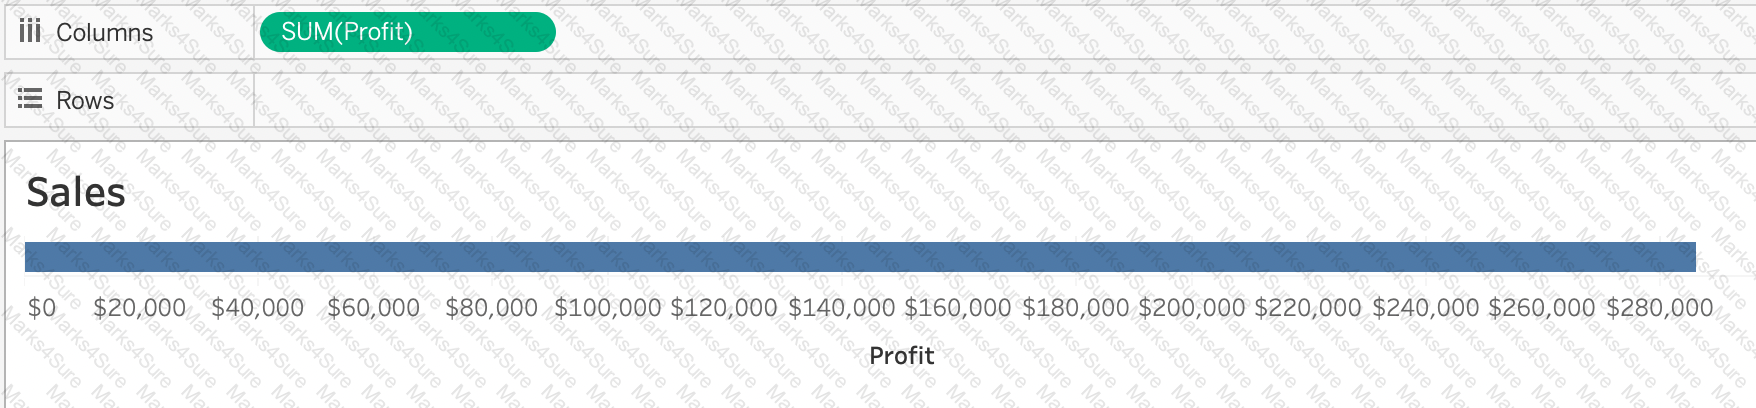
You create the following visualization.
What is the first step to create the visual grouping of the 10 marks shown in blue?
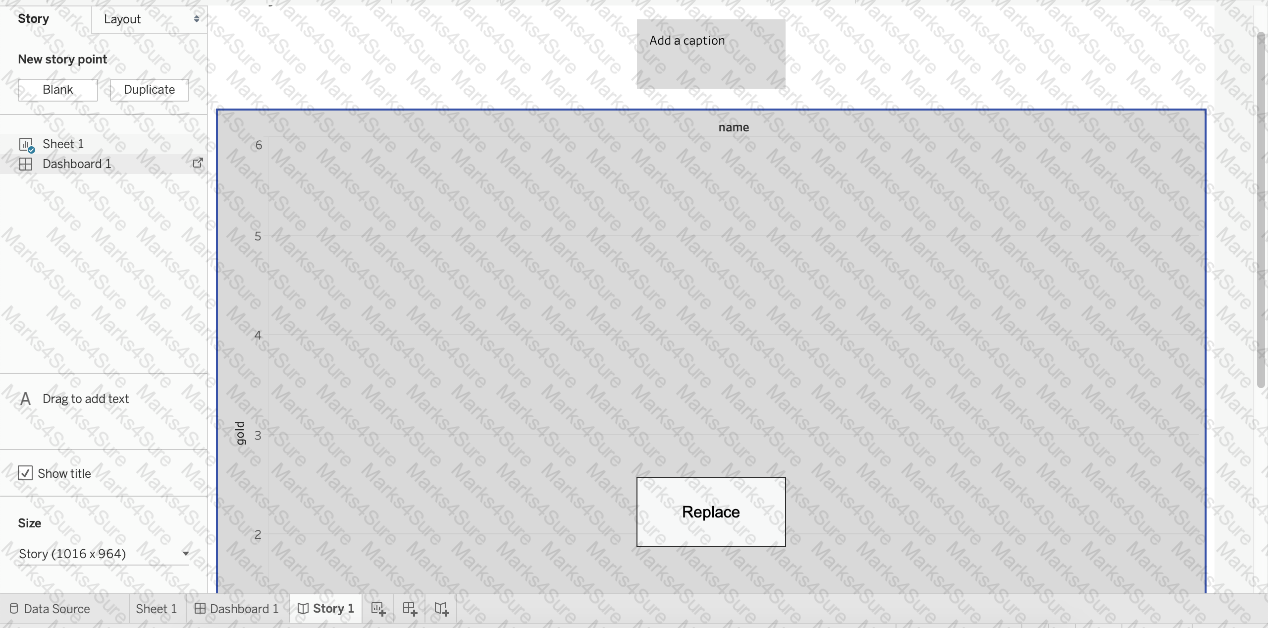
Is it possible to add both a Dashboard and a Worksheet at the same time to a Story Point in Tableau?
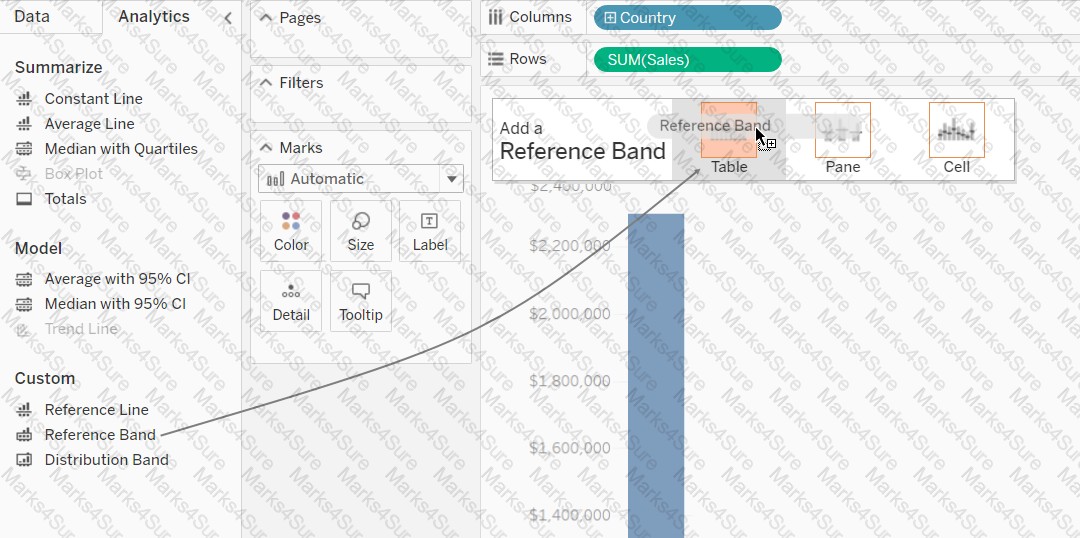
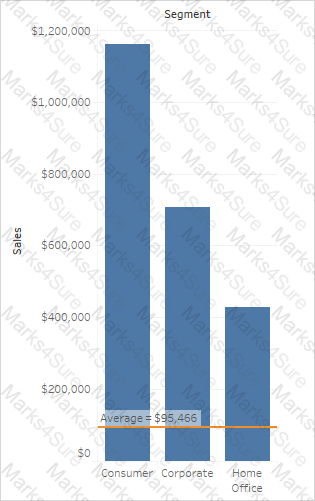
What statement correctly describes a requirement to create a reference line in Tableau?
What is the one most important thing you should do after creating a Dual-axis chart?
Which aggregation is available without requiring a table calculation or calculated field?
You have cleaned a data source properly, created some calculated fields and renamed some columns. You want to save these changes for future use cases. Which of the following would BEST satisfy this requirement?
Yes or No: The number of marks will increase when you increase the number of Dimensions in a view
For which of the following charts, does the Size option on the Marks card not work?
Using the Time Series table, create a cross-tab showing sales for each Assortment broken down by Year and Quarter. In Q4 of October 2017, what was the Average sales amount for the Hardware assortment?
The View Data window displays as much of the data as possible by default, up to _______________ rows.
If you are working with a huge dataset, which of the following are strong reasons to use a context filter?
True or False: When relating tables, the fields that define the relationships must have the same data type.
When creating an extract, what are three options for specifying how much data to extract? Choose three.
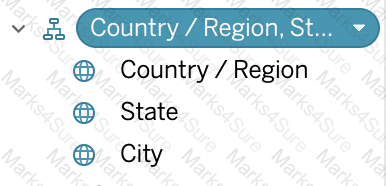
What are two use cases for creating hierarchies from the Data pane? Choose two.
________________ is hosted by Tableau to share our visualisations publically with the world.
If you decide you want to see all of the marks in the view at the most detailed level of granularity, you can __________________ the view.
Which two options can you use to change the device layout of a dashboard? Choose two.
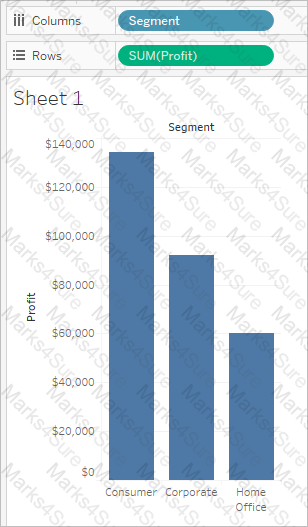
You have a continuous numeric measure named Sales.
Which chart type is created when you double-click the Sales measure?
Which of the following is a compelling reason to export a sheet in Tableau to a PDF?
You need to display the complete list of potential data connections when you connect to a server. What action should you perform?
What is created by a calculated field that has a formula of SUM(Sales)/SUM(Profit)?
Which of the following are the options to export the data used to build the view / visualisations?
Which of the following are valid use-cases for the ' Manage Metadata ' functionality?
__________ is a technique in Tableau which will identify marks with similar characteristics
Using the Time-series table, create a cross tab showing the Sales for each Item Number-ID, broken down by Assortments, then add Grand totals to the view. Which Item Number ID made the maximum sales across all assortments?
You need to access options to change a dimension ' s color palette.
In addition to the Marks card, what else can you use?
What is the minimum amount of RAM recommended for any production use of Tableau Server?
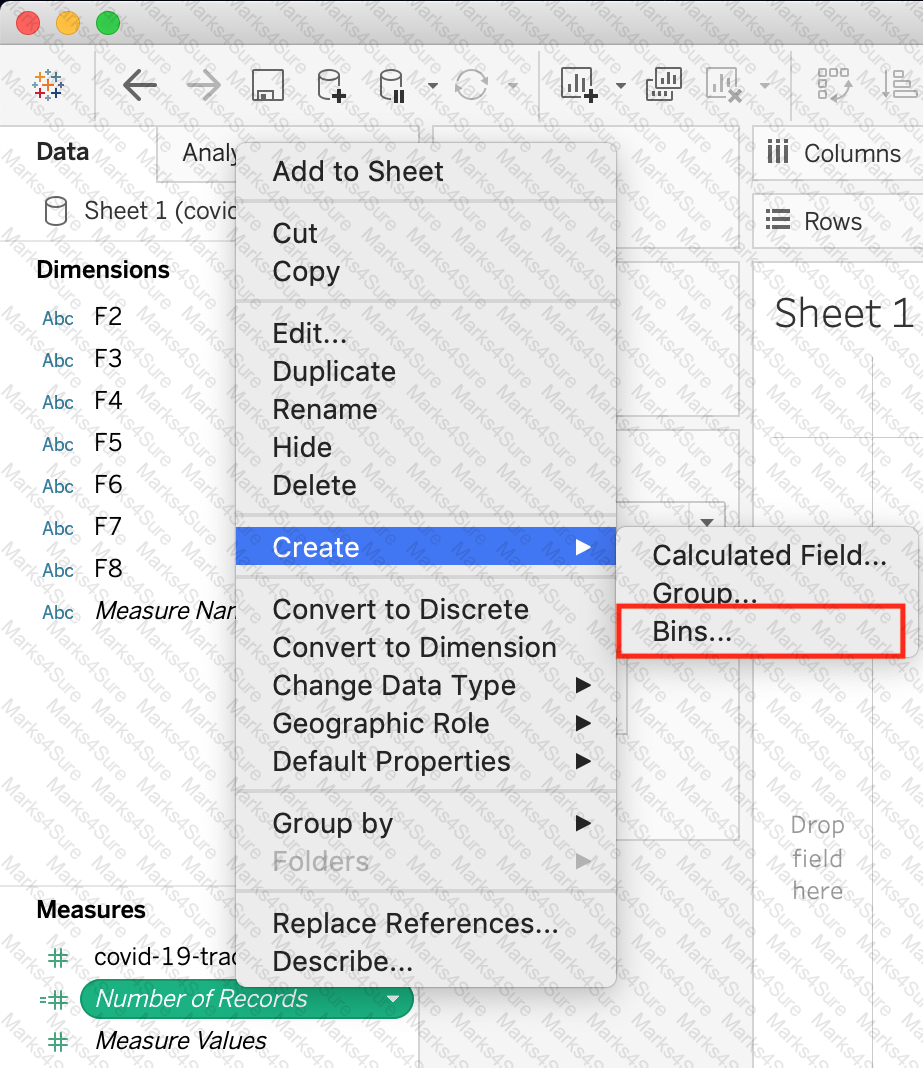
 Graphical user interface, text, application, email, Teams
Description automatically generated
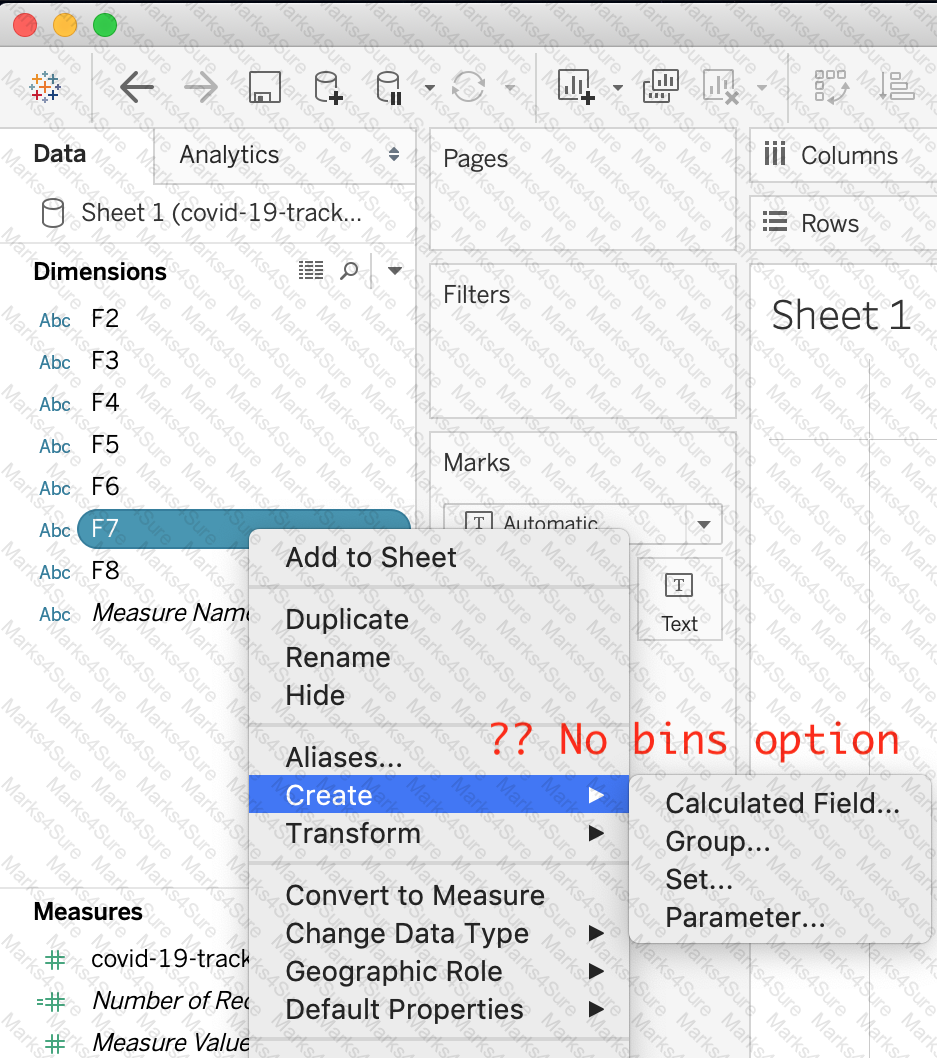
Graphical user interface, text, application, email, Teams
Description automatically generated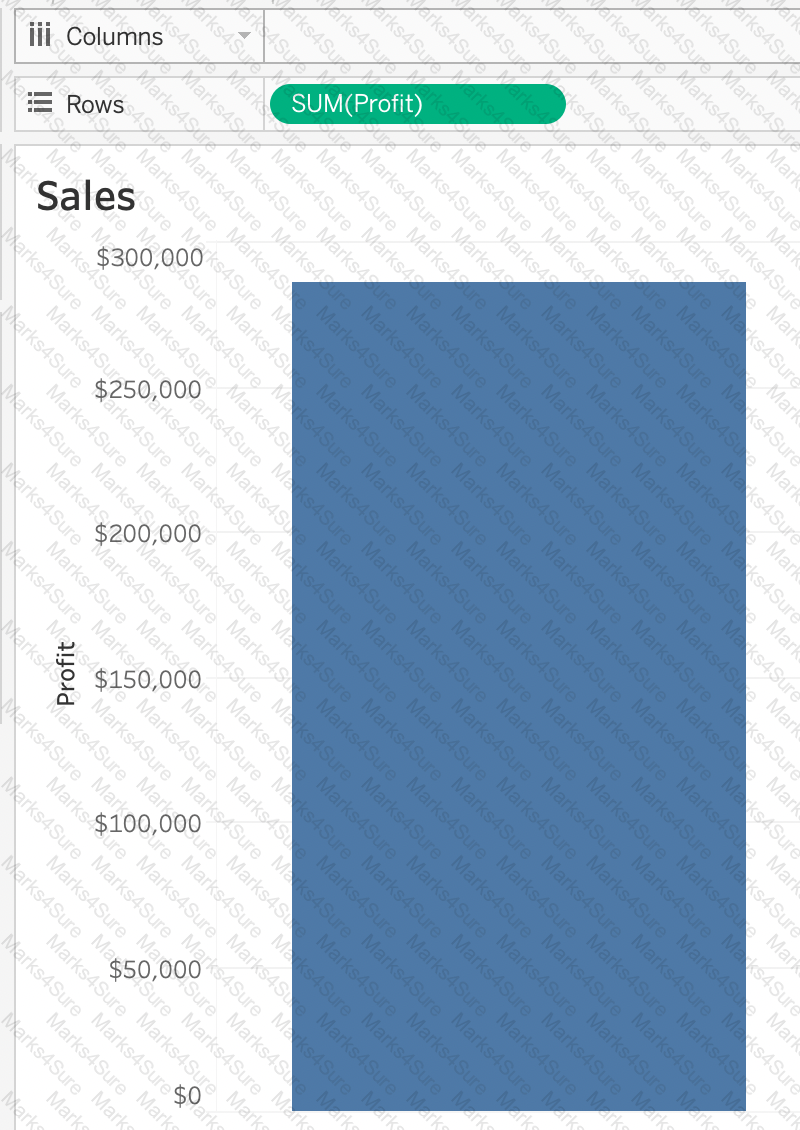 Graphical user interface
Description automatically generated with low confidence
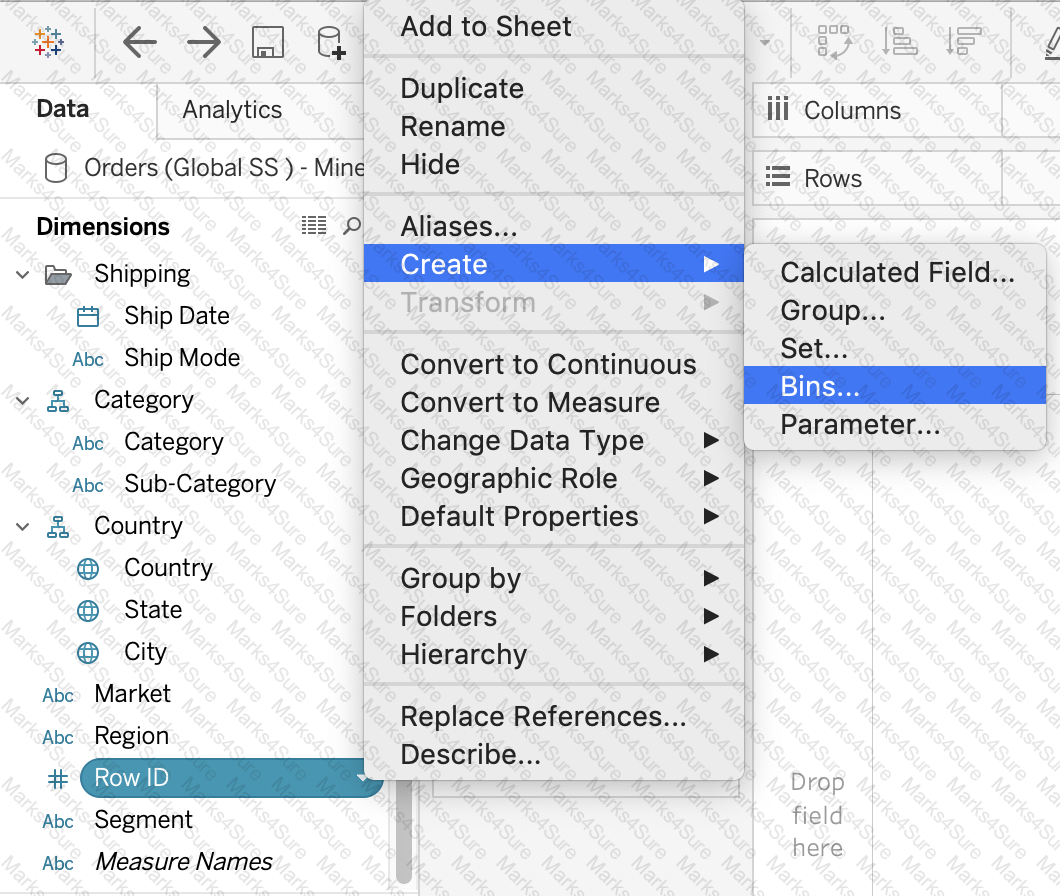
Graphical user interface
Description automatically generated with low confidenceSkipped Join the Geo Data and Time Series Table on the Item Number ID column, and display the Store count for every State on a Map. What was the Store count in 2017 for Texas (TX)?
Join the Geo Data and Time Series Table on the Item Number ID column, and display the Store count for every State on a Map. What was the Store count in 2017 for Texas (TX)?
Which of the following would you use to connect to multiple tables in a single data source at once?
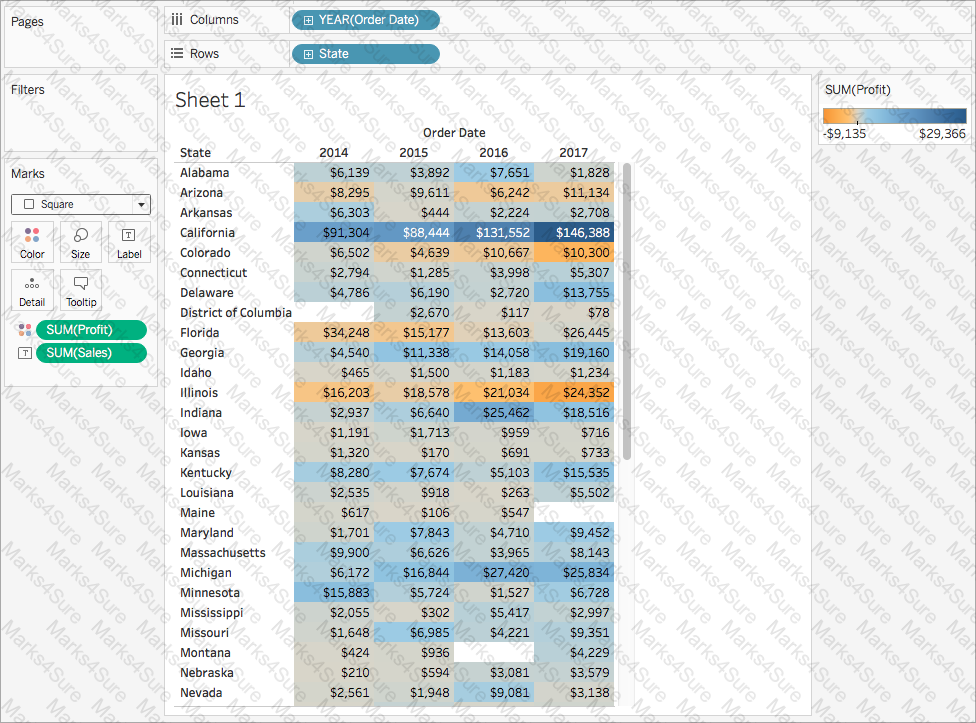
You need to invert the color intensity of a quantitative range. Which option should you use?
Is it possible to use measures in the same view multiple times (e.g. SUM of the measure and AVG of the measure)?
You view the relationship canvas shown in the following exhibit.
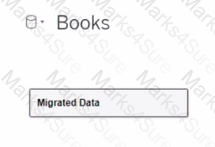
What does Migrated Data indicate?
Which statement accurately describes an extract when the Physical Tables option is selected?
How can you MANUALLY assign geographic roles to a dimension from the data pane?
You have the following visualization.
Which set type is created when you select the Create Set option?
To connect Tableau to a CSV data source what type of connection should you use?
PDF + Testing Engine

Testing Engine
PDF (Q&A)